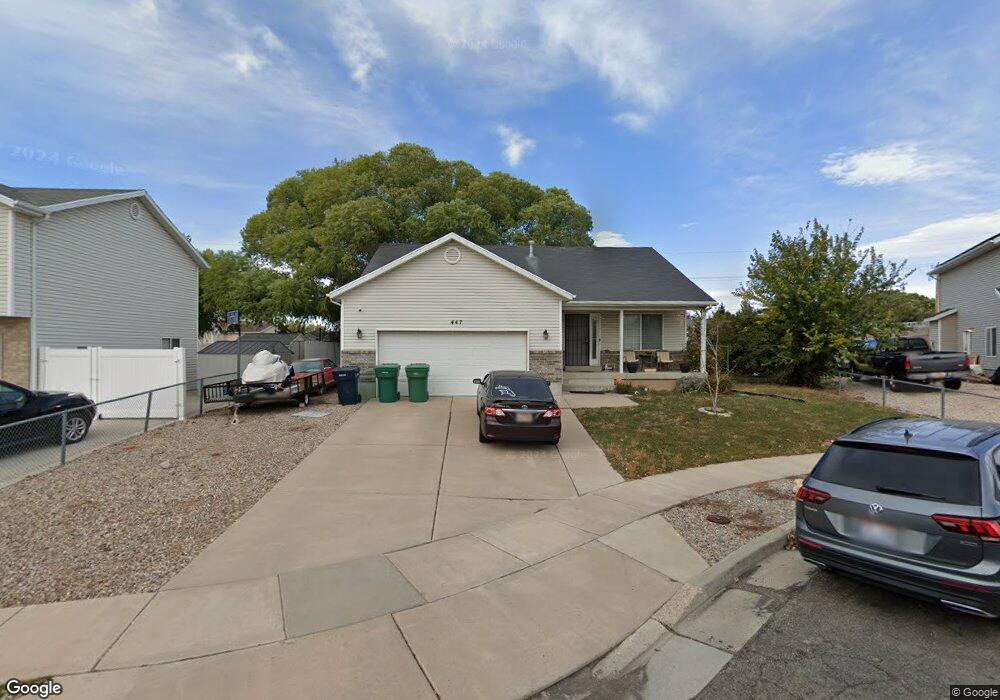
447 W 275 N Unit 24 Clearfield, UT 84015
Estimated Value: $410,000 - $445,000
2
Beds
3
Baths
1,962
Sq Ft
$219/Sq Ft
Est. Value
About This Home
This home is located at 447 W 275 N Unit 24, Clearfield, UT 84015 and is currently estimated at $429,696, approximately $219 per square foot. 447 W 275 N Unit 24 is a home located in Davis County with nearby schools including Holt Elementary School, North Davis Junior High School, and Clearfield High School.
Ownership History
Date
Name
Owned For
Owner Type
Purchase Details
Closed on
Jun 7, 2011
Sold by
Bilagody Michael L and Bilagody Angela H
Bought by
Brcko Angelique
Current Estimated Value
Home Financials for this Owner
Home Financials are based on the most recent Mortgage that was taken out on this home.
Original Mortgage
$6,228
Outstanding Balance
$4,294
Interest Rate
4.71%
Mortgage Type
Stand Alone Second
Estimated Equity
$425,402
Purchase Details
Closed on
May 28, 1999
Sold by
S M Carter Company and Bilagody Michael
Bought by
Bilagody Michael L and Bilagody Angela H
Home Financials for this Owner
Home Financials are based on the most recent Mortgage that was taken out on this home.
Original Mortgage
$124,963
Interest Rate
6.86%
Mortgage Type
FHA
Purchase Details
Closed on
Jan 7, 1999
Sold by
Kruitbosch Gary
Bought by
S M Carter Company and Bilagody Michael
Create a Home Valuation Report for This Property
The Home Valuation Report is an in-depth analysis detailing your home's value as well as a comparison with similar homes in the area
Home Values in the Area
Average Home Value in this Area
Purchase History
| Date | Buyer | Sale Price | Title Company |
|---|---|---|---|
| Brcko Angelique | -- | Inwest Title Services | |
| Bilagody Michael L | -- | Security Title Company | |
| S M Carter Company | -- | Security Title Company |
Source: Public Records
Mortgage History
| Date | Status | Borrower | Loan Amount |
|---|---|---|---|
| Open | Brcko Angelique | $6,228 | |
| Open | Brcko Angelique | $142,785 | |
| Previous Owner | Bilagody Michael L | $124,963 |
Source: Public Records
Tax History Compared to Growth
Tax History
| Year | Tax Paid | Tax Assessment Tax Assessment Total Assessment is a certain percentage of the fair market value that is determined by local assessors to be the total taxable value of land and additions on the property. | Land | Improvement |
|---|---|---|---|---|
| 2025 | $2,596 | $232,650 | $74,852 | $157,798 |
| 2024 | $2,510 | $226,600 | $71,569 | $155,031 |
| 2023 | $2,318 | $384,000 | $114,638 | $269,362 |
| 2022 | $2,473 | $221,650 | $62,631 | $159,019 |
| 2021 | $2,275 | $308,000 | $66,037 | $241,963 |
| 2020 | $1,971 | $265,000 | $55,435 | $209,565 |
| 2019 | $1,906 | $253,000 | $58,471 | $194,529 |
| 2018 | $1,732 | $224,000 | $51,899 | $172,101 |
| 2016 | $1,550 | $104,775 | $20,694 | $84,081 |
| 2015 | $1,556 | $100,320 | $20,694 | $79,626 |
| 2014 | $1,328 | $86,774 | $20,694 | $66,080 |
| 2013 | -- | $77,254 | $31,537 | $45,717 |
Source: Public Records
Map
Nearby Homes
- 447 W 275 N
- 465 W 275 N
- 465 W 275 N Unit 25
- 435 W 275 N
- 475 W 275 N
- 475 W 275 N Unit 26
- 427 W 275 N Unit 22
- 457 W 325 N
- 471 W 325 N
- 456 W 275 N
- 456 W 275 N Unit 19
- 444 W 275 N Unit 20
- 425 W 300 N
- 489 W 275 N
- 489 W 275 N Unit 27
- 432 W 275 N Unit 21
- 468 W 275 N
- 468 W 275 N Unit 18
- 443 W 325 N
- 326 N 475 W