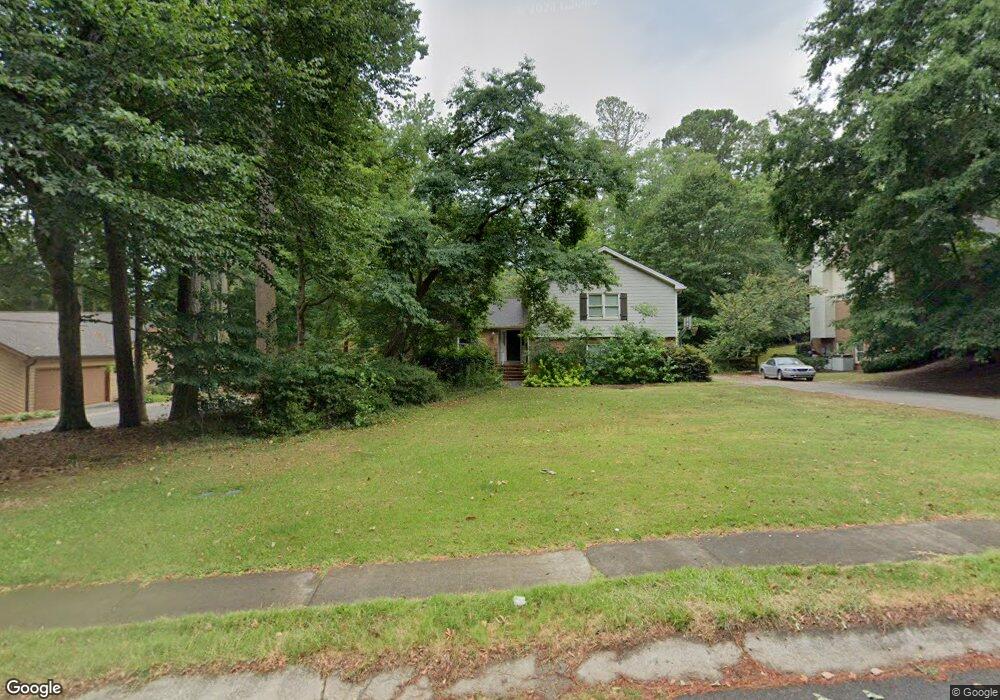
4470 E Jones Bridge Rd Norcross, GA 30092
Estimated Value: $499,000 - $569,000
4
Beds
3
Baths
1,751
Sq Ft
$302/Sq Ft
Est. Value
About This Home
This home is located at 4470 E Jones Bridge Rd, Norcross, GA 30092 and is currently estimated at $529,124, approximately $302 per square foot. 4470 E Jones Bridge Rd is a home located in Gwinnett County with nearby schools including Simpson Elementary School, Pinckneyville Middle School, and Norcross High School.
Ownership History
Date
Name
Owned For
Owner Type
Purchase Details
Closed on
May 15, 2020
Sold by
James Daniel R
Bought by
Haro Kevin
Current Estimated Value
Home Financials for this Owner
Home Financials are based on the most recent Mortgage that was taken out on this home.
Original Mortgage
$346,750
Outstanding Balance
$305,920
Interest Rate
3.3%
Estimated Equity
$223,205
Purchase Details
Closed on
Mar 5, 2002
Sold by
Percy Cayman M
Bought by
James Cayman P and James Daniel R
Home Financials for this Owner
Home Financials are based on the most recent Mortgage that was taken out on this home.
Original Mortgage
$24,000
Interest Rate
6.86%
Mortgage Type
Credit Line Revolving
Purchase Details
Closed on
Feb 28, 2001
Sold by
Patel Kanti S and Patel Shanta K
Bought by
Percy Cayman M
Home Financials for this Owner
Home Financials are based on the most recent Mortgage that was taken out on this home.
Original Mortgage
$151,200
Interest Rate
7.12%
Mortgage Type
New Conventional
Create a Home Valuation Report for This Property
The Home Valuation Report is an in-depth analysis detailing your home's value as well as a comparison with similar homes in the area
Home Values in the Area
Average Home Value in this Area
Purchase History
| Date | Buyer | Sale Price | Title Company |
|---|---|---|---|
| Haro Kevin | $365,000 | -- | |
| James Cayman P | -- | -- | |
| Percy Cayman M | $189,000 | -- |
Source: Public Records
Mortgage History
| Date | Status | Borrower | Loan Amount |
|---|---|---|---|
| Open | Haro Kevin | $346,750 | |
| Previous Owner | James Cayman P | $24,000 | |
| Previous Owner | Percy Cayman M | $151,200 |
Source: Public Records
Tax History
| Year | Tax Paid | Tax Assessment Tax Assessment Total Assessment is a certain percentage of the fair market value that is determined by local assessors to be the total taxable value of land and additions on the property. | Land | Improvement |
|---|---|---|---|---|
| 2025 | $5,677 | $185,840 | $38,000 | $147,840 |
| 2024 | $6,163 | $202,640 | $40,000 | $162,640 |
| 2023 | $6,163 | $180,240 | $32,000 | $148,240 |
| 2022 | $5,708 | $180,240 | $32,000 | $148,240 |
| 2021 | $4,994 | $141,240 | $27,760 | $113,480 |
| 2020 | $5,066 | $133,040 | $27,760 | $105,280 |
| 2019 | $0 | $125,360 | $28,000 | $97,360 |
| 2018 | $3,208 | $110,360 | $24,000 | $86,360 |
| 2016 | $2,715 | $89,320 | $24,000 | $65,320 |
| 2015 | $2,738 | $89,320 | $24,000 | $65,320 |
| 2014 | $2,612 | $89,320 | $24,000 | $65,320 |
Source: Public Records
Map
Nearby Homes
- 5124 Bandolino Ln Unit 323
- 5028 Shirley Oaks Dr Unit 284
- 4477 Watervale Way Unit 286
- 5047 Shirley Oaks Dr Unit 313
- 4923 Sudbrook Way Unit 233
- 4933 Sudbrook Way Unit 230
- 5038 Shirley Oaks Dr Unit 281
- 4903 Sudbrook Way Unit 239
- 5039 Shirley Oaks Dr Unit 315
- 4469 Watervale Way Unit 288
- 4489 Waterside Pkwy
- 5368 Broadwood Ave
- 5054 Sealy Cir
- 5213 Creek Walk Cir
- 4048 Blandford St
- 5350 Wickershire Dr
- 5221 W Jones Bridge Rd
- 5478 Bandolino Ln Unit 422
- 5482 Bandolino Ln Unit 424
- 4561 Deanston Ct Unit 386
- 4470 E Jones Bridge Rd
- 4478 E Jones Bridge Rd
- 4462 E Jones Bridge Rd
- 4462 E Jones Bridge Rd
- 5227 Fox Hill Ct Unit 2
- 4486 E Jones Bridge Rd
- 5217 Fox Hill Ct
- 4467 Jones Bridge Cir
- 4454 E Jones Bridge Rd
- 5215 Fox Hill Dr
- 5237 Fox Hill Ct
- 4467 E Jones Bridge Rd
- 5225 Fox Hill Dr
- 5225 Fox Hill Dr NW
- 4496 E Jones Bridge Rd
- 4457 E Jones Bridge Rd
- 4457 E Jones Bridge Rd
- 5184 Sunburst Dr
- 5235 Fox Hill Dr
- 5247 Fox Hill Ct Unit 2
Your Personal Tour Guide
Ask me questions while you tour the home.