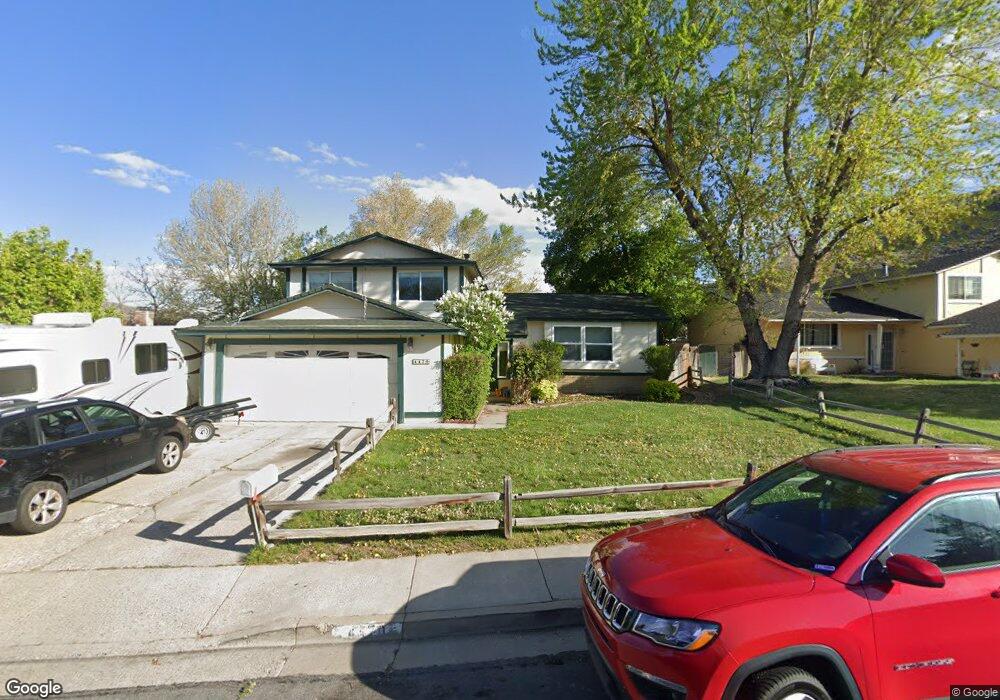
4470 Spring Dr Reno, NV 89502
Hidden Valley NeighborhoodEstimated Value: $541,000 - $573,000
4
Beds
3
Baths
2,128
Sq Ft
$261/Sq Ft
Est. Value
About This Home
This home is located at 4470 Spring Dr, Reno, NV 89502 and is currently estimated at $555,044, approximately $260 per square foot. 4470 Spring Dr is a home located in Washoe County with nearby schools including Edwin S. Dodson Elementary School, Edward L Pine Middle School, and Earl Wooster High School.
Ownership History
Date
Name
Owned For
Owner Type
Purchase Details
Closed on
May 12, 2015
Sold by
Tah Securitized Rsp Llc
Bought by
Tah 2015 1 Equity Owner Llc
Current Estimated Value
Purchase Details
Closed on
Sep 5, 2013
Sold by
Five Ten Real Estate Opportunities Fund
Bought by
Mckinley Holding I Lp
Purchase Details
Closed on
Jan 23, 2012
Sold by
Samaniego Laura and Samaniego Robin
Bought by
Five Ten Real Estate Opportunities Fund
Purchase Details
Closed on
Oct 21, 1996
Sold by
Gillooly Fabian Lee and Woo Won Sook
Bought by
Samaniego Robin A and Samaniego Laura M
Home Financials for this Owner
Home Financials are based on the most recent Mortgage that was taken out on this home.
Original Mortgage
$155,777
Interest Rate
8.37%
Mortgage Type
FHA
Create a Home Valuation Report for This Property
The Home Valuation Report is an in-depth analysis detailing your home's value as well as a comparison with similar homes in the area
Home Values in the Area
Average Home Value in this Area
Purchase History
We collect this data history from publicly available records. To have your information removed, we recommend requesting removal directly through your county’s website.
| Date | Buyer | Sale Price | Title Company |
|---|---|---|---|
| Tah 2015 1 Equity Owner Llc | -- | None Available | |
| Tah Securitized Rsp Llc | -- | None Available | |
| Mickinley Equity Lp | -- | None Available | |
| Mckinley Holding I Lp | $303,000 | None Available | |
| Five Ten Real Estate Opportunities Fund | $113,300 | Accommodation | |
| Samaniego Robin A | $162,500 | Stewart Title Company |
Source: Public Records
Mortgage History
We collect this data history from publicly available records. To have your information removed, we recommend requesting removal directly through your county’s website.
| Date | Status | Borrower | Loan Amount |
|---|---|---|---|
| Previous Owner | Samaniego Robin A | $155,777 |
Source: Public Records
Tax History
| Year | Tax Paid | Tax Assessment Tax Assessment Total Assessment is a certain percentage of the fair market value that is determined by local assessors to be the total taxable value of land and additions on the property. | Land | Improvement |
|---|---|---|---|---|
| 2026 | $1,903 | $68,630 | $33,957 | $34,673 |
| 2024 | $2,355 | $68,293 | $30,923 | $37,371 |
| 2023 | $2,183 | $68,747 | $32,519 | $36,229 |
| 2022 | $2,022 | $57,875 | $26,999 | $30,876 |
| 2021 | $1,872 | $50,951 | $19,618 | $31,333 |
| 2020 | $1,774 | $51,615 | $19,618 | $31,997 |
| 2019 | $1,655 | $50,481 | $19,917 | $30,564 |
| 2018 | $1,580 | $44,396 | $14,065 | $30,331 |
| 2017 | $1,516 | $44,015 | $13,167 | $30,848 |
| 2016 | $1,479 | $42,755 | $10,773 | $31,982 |
| 2015 | -- | $42,209 | $9,609 | $32,600 |
| 2014 | $1,444 | $40,028 | $8,446 | $31,582 |
| 2013 | -- | $37,773 | $6,300 | $31,473 |
Source: Public Records
Map
Nearby Homes
- 4321 Leeward Ln
- 4335 Leeward Ln
- 37 Lucky Ln
- 3881 Amador Way
- 10 Lucky Ln
- 4405 Mesa Grande Ct
- 4730 Spring Dr
- 4572 Creekside Cir
- 4760 Spring Dr
- 320 Lucky Ln
- 3532 Caballo Alto Ct
- 4380 Matich Dr
- 4046 Weeping Willow Ct
- 4455 Matich Dr
- 317 Lucky Ln
- 4444 Matich Dr Unit 157
- 4557 Reggie Rd
- 4496 Matich Dr Unit 141
- 4550 Matich Dr Unit 149
- 4400 Alexander Lake Rd
- 4450 Spring Dr
- 4285 Rio Poco Rd
- 4275 Rio Poco Rd
- 4295 Rio Poco Rd
- 4430 Spring Dr
- 4410 Spring Dr
- 4415 Spring Dr
- 4405 Spring Dr
- 4425 Spring Dr
- 4485 Spring Dr
- 4280 Rio Poco Rd
- 4401 Spring Dr
- 4400 Spring Dr
- 4270 Rio Poco Rd Unit 2C3
- 4290 Rio Poco Rd
- 4087 Snowshoe Ln Unit 1
- 4089 Snowshoe Ln
- 4420 Camino Lindo Way
- 4091 Snowshoe Ln Unit 1
- 4195 Rio Poco Rd
Your Personal Tour Guide
Ask me questions while you tour the home.