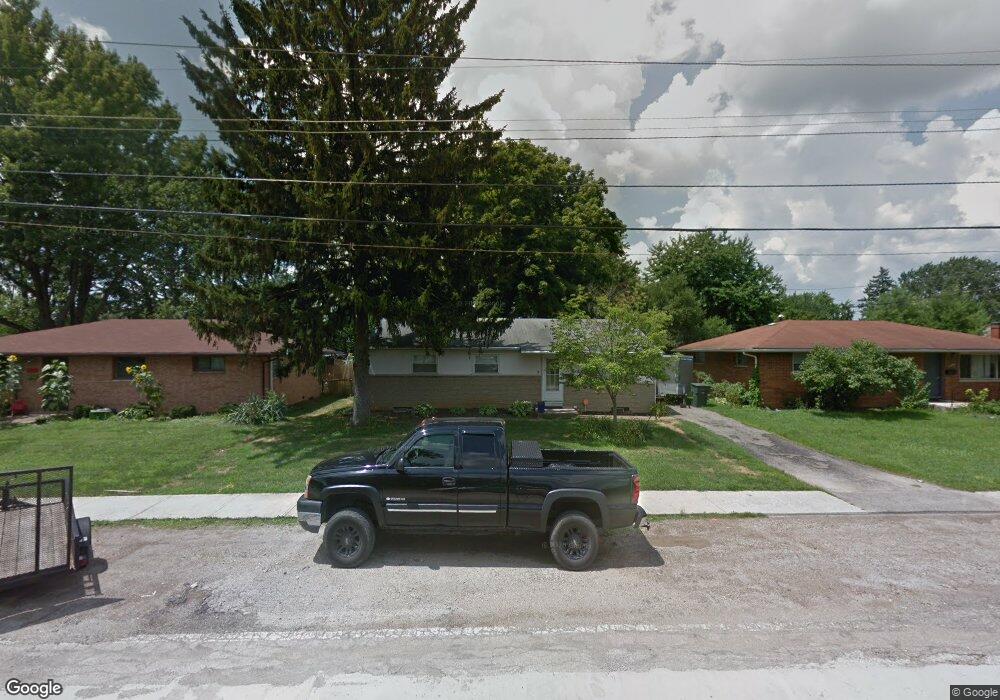
4471 Maize Rd Columbus, OH 43224
Maize-Morse NeighborhoodEstimated Value: $196,000 - $245,000
3
Beds
2
Baths
1,118
Sq Ft
$199/Sq Ft
Est. Value
About This Home
This home is located at 4471 Maize Rd, Columbus, OH 43224 and is currently estimated at $222,305, approximately $198 per square foot. 4471 Maize Rd is a home located in Franklin County with nearby schools including Maize Road Elementary School, Medina Middle School, and Mifflin High School.
Ownership History
Date
Name
Owned For
Owner Type
Purchase Details
Closed on
Jun 8, 2009
Sold by
M H Murphy Development Company
Bought by
Iacobucci Caterina B
Current Estimated Value
Home Financials for this Owner
Home Financials are based on the most recent Mortgage that was taken out on this home.
Original Mortgage
$69,959
Outstanding Balance
$43,580
Interest Rate
4.83%
Mortgage Type
FHA
Estimated Equity
$178,725
Purchase Details
Closed on
Oct 15, 2008
Sold by
Yunker David J
Bought by
M H Murphy Development Co
Purchase Details
Closed on
Jul 23, 1999
Sold by
Runk David A and Runk Heather A
Bought by
Yunker David J
Home Financials for this Owner
Home Financials are based on the most recent Mortgage that was taken out on this home.
Original Mortgage
$67,500
Interest Rate
7.5%
Purchase Details
Closed on
Nov 3, 1989
Bought by
Runk David A
Purchase Details
Closed on
Oct 23, 1987
Create a Home Valuation Report for This Property
The Home Valuation Report is an in-depth analysis detailing your home's value as well as a comparison with similar homes in the area
Home Values in the Area
Average Home Value in this Area
Purchase History
| Date | Buyer | Sale Price | Title Company |
|---|---|---|---|
| Iacobucci Caterina B | $71,300 | Stewart Tit | |
| M H Murphy Development Co | $93,000 | Stewart Tit | |
| Yunker David J | $75,000 | Connor Title Co | |
| Runk David A | $57,700 | -- | |
| -- | $49,900 | -- |
Source: Public Records
Mortgage History
| Date | Status | Borrower | Loan Amount |
|---|---|---|---|
| Open | Iacobucci Caterina B | $69,959 | |
| Previous Owner | Yunker David J | $67,500 |
Source: Public Records
Tax History
| Year | Tax Paid | Tax Assessment Tax Assessment Total Assessment is a certain percentage of the fair market value that is determined by local assessors to be the total taxable value of land and additions on the property. | Land | Improvement |
|---|---|---|---|---|
| 2025 | $3,038 | $67,690 | $20,020 | $47,670 |
| 2024 | $3,038 | $67,690 | $20,020 | $47,670 |
| 2023 | $2,999 | $67,690 | $20,020 | $47,670 |
| 2022 | $2,226 | $42,910 | $8,190 | $34,720 |
| 2021 | $2,229 | $42,910 | $8,190 | $34,720 |
| 2020 | $2,232 | $42,910 | $8,190 | $34,720 |
| 2019 | $2,103 | $34,660 | $6,550 | $28,110 |
| 2018 | $1,762 | $34,660 | $6,550 | $28,110 |
| 2017 | $2,101 | $34,660 | $6,550 | $28,110 |
| 2016 | $1,570 | $23,700 | $5,360 | $18,340 |
| 2015 | $1,425 | $23,700 | $5,360 | $18,340 |
| 2014 | $1,429 | $23,700 | $5,360 | $18,340 |
| 2013 | $742 | $24,955 | $5,635 | $19,320 |
Source: Public Records
Map
Nearby Homes
- 1144 Reed Circle Dr
- 1130 Carbone Dr
- 899 Meadowview Dr
- 4605 Glenmawr Ave
- 827 Inwood Place
- 1116 Tulsa Dr
- 4143 Karl Rd Unit 215
- 4143 Karl Rd Unit 314
- 4145 Karl Rd Unit 223
- 4800 Bourke Rd
- 3967 Karl Rd Unit 224
- 3941 Karl Rd Unit 326
- 4795 Colonel Perry Dr
- 4983 Almont Dr
- 3939 Karl Rd Unit 311
- 601 Morse Rd
- 1485 Norma Rd
- 4923 Karl Rd Unit 4925
- 991 Hidden Acres Ct Unit 991
- 5004 Julie Place
- 4463 Maize Rd
- 4479 Maize Rd
- 4455 Maize Rd
- 4466 Wetmore Rd E
- 1167 Reed Circle Dr
- 1161 Reed Circle Dr
- 4447 Maize Rd
- 4458 Wetmore Rd E
- 1151 Reed Circle Dr
- 4474 Wetmore Rd E
- 4439 Maize Rd
- 4448 Wetmore Rd E
- 4480 Wetmore Rd E
- 1143 Reed Circle Dr
- 4431 Maize Rd
- 4440 Wetmore Rd E
- 4515 Maize Rd
- 4459 Wetmore Rd E
- 1160 Reed Circle Dr
- 1140 Reed Circle Dr
Your Personal Tour Guide
Ask me questions while you tour the home.