Estimated Value: $460,431 - $509,000
5
Beds
3
Baths
3,268
Sq Ft
$149/Sq Ft
Est. Value
About This Home
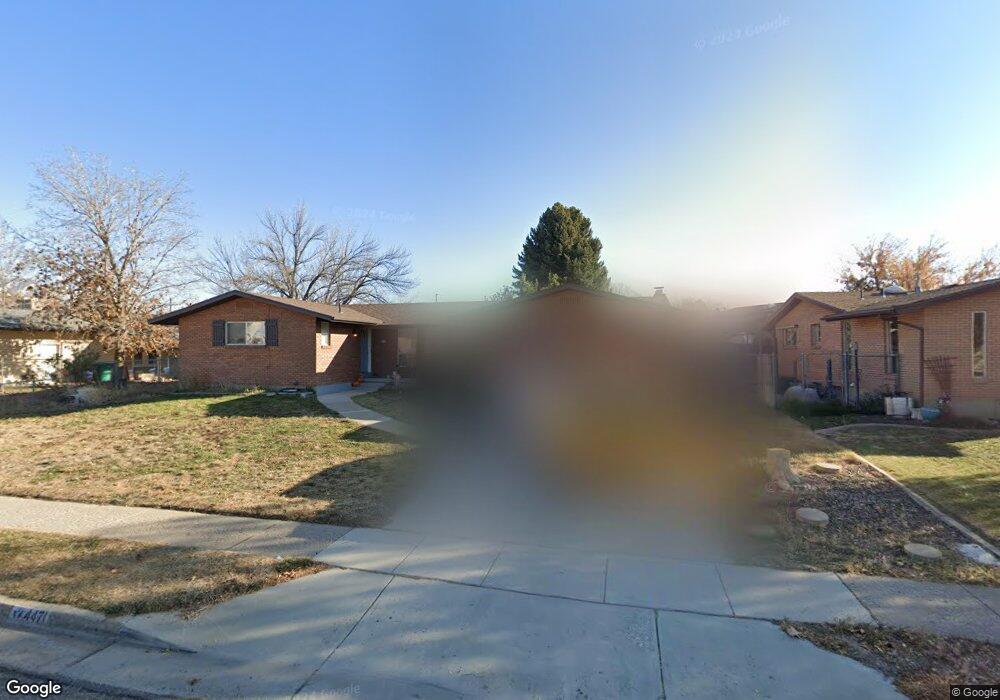
This home is located at 4471 S 2300 W, Roy, UT 84067 and is currently estimated at $488,108, approximately $149 per square foot. 4471 S 2300 W is a home located in Weber County with nearby schools including Valley View School, Sand Ridge Junior High School, and Roy High School.
Ownership History
Date
Name
Owned For
Owner Type
Purchase Details
Closed on
Sep 4, 2018
Sold by
Butler Leann M and Monson Eric H
Bought by
Back Christopher S and Back London Cherie
Current Estimated Value
Home Financials for this Owner
Home Financials are based on the most recent Mortgage that was taken out on this home.
Original Mortgage
$232,773
Outstanding Balance
$203,010
Interest Rate
4.6%
Mortgage Type
VA
Estimated Equity
$285,098
Purchase Details
Closed on
Aug 28, 2018
Sold by
Butler Leann M and Monson Erie H
Bought by
Back Christopher S and Back London Cherie
Home Financials for this Owner
Home Financials are based on the most recent Mortgage that was taken out on this home.
Original Mortgage
$232,773
Outstanding Balance
$203,010
Interest Rate
4.6%
Mortgage Type
VA
Estimated Equity
$285,098
Purchase Details
Closed on
Jun 12, 2017
Sold by
Monson L Darlene and Farrell R Monson Family Inter
Bought by
The Darlene Monson Trust
Purchase Details
Closed on
Oct 30, 2006
Sold by
Monson Farrell R and Darlene Monson L
Bought by
Monson Farrell R and Darlene Monson L
Create a Home Valuation Report for This Property
The Home Valuation Report is an in-depth analysis detailing your home's value as well as a comparison with similar homes in the area
Home Values in the Area
Average Home Value in this Area
Purchase History
| Date | Buyer | Sale Price | Title Company |
|---|---|---|---|
| Back Christopher S | -- | Accommodation | |
| Back Christopher S | -- | Backman Title Services Ltd | |
| The Darlene Monson Trust | -- | None Available | |
| Monson Farrell R | -- | None Available |
Source: Public Records
Mortgage History
| Date | Status | Borrower | Loan Amount |
|---|---|---|---|
| Open | Back Christopher S | $232,773 |
Source: Public Records
Tax History
| Year | Tax Paid | Tax Assessment Tax Assessment Total Assessment is a certain percentage of the fair market value that is determined by local assessors to be the total taxable value of land and additions on the property. | Land | Improvement |
|---|---|---|---|---|
| 2025 | $3,068 | $494,517 | $145,328 | $349,189 |
| 2024 | $2,994 | $267,299 | $79,930 | $187,369 |
| 2023 | $2,891 | $258,500 | $80,480 | $178,020 |
| 2022 | $2,765 | $253,000 | $56,280 | $196,720 |
| 2021 | $2,391 | $361,000 | $68,071 | $292,929 |
| 2020 | $2,178 | $301,000 | $68,071 | $232,929 |
| 2019 | $2,086 | $271,000 | $38,977 | $232,023 |
| 2018 | $1,936 | $236,000 | $35,972 | $200,028 |
| 2017 | $1,921 | $220,347 | $35,972 | $184,375 |
| 2016 | $1,752 | $107,436 | $17,477 | $89,959 |
| 2015 | $1,510 | $93,720 | $17,477 | $76,243 |
| 2014 | $1,470 | $89,968 | $17,477 | $72,491 |
Source: Public Records
Map
Nearby Homes
- 4328 S 2175 W
- 2015 W 4450 S
- 2038 W 4600 S
- 4248 S 2400 W
- 4220 S 2075 W
- 2015 W 4225 S
- 4642 S 1900 W Unit 41
- 2602 W 4600 S
- 4881 S 2400 W
- 4061 S 2175 W
- 4602 Hathaway Dr
- 4047 S 2175 W
- 4297 Westlake Dr
- 4598 S Blossom Glen Way
- 4732 S West Park Dr
- 1959 3985 St S Unit 2
- 1838 W 5050 S
- 2815 W 4275 S
- 2581 W 5000 S
- 1829 W 5050 S
Your Personal Tour Guide
Ask me questions while you tour the home.