Estimated Value: $401,663 - $458,000
5
Beds
3
Baths
1,461
Sq Ft
$294/Sq Ft
Est. Value
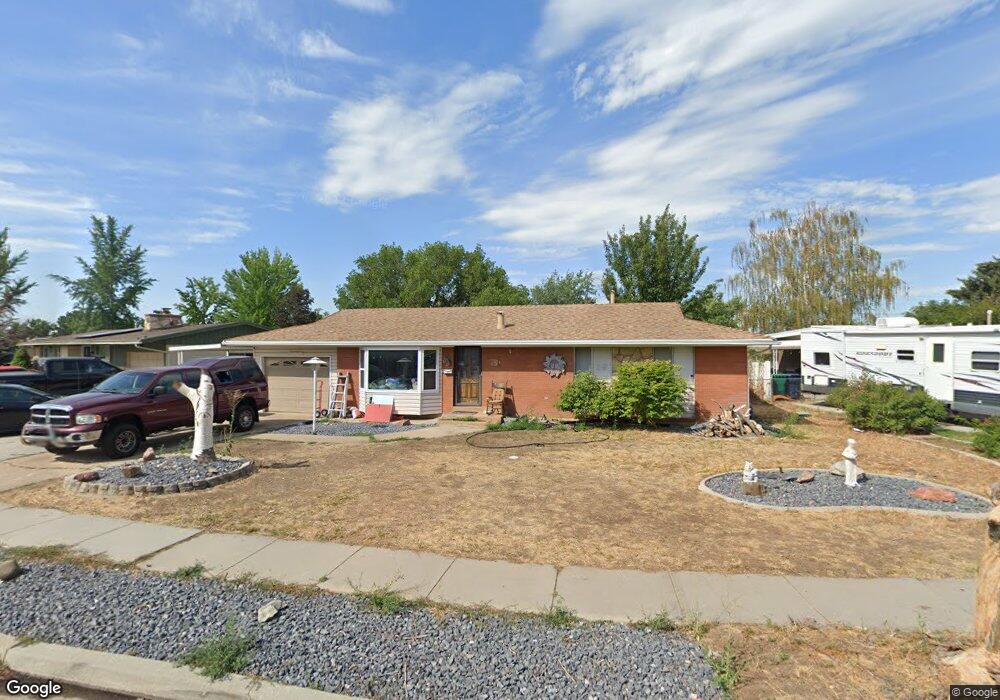
About This Home
This home is located at 4471 S 2450 W, Roy, UT 84067 and is currently estimated at $428,916, approximately $293 per square foot. 4471 S 2450 W is a home located in Weber County with nearby schools including Valley View School, Sand Ridge Junior High School, and Roy High School.
Ownership History
Date
Name
Owned For
Owner Type
Purchase Details
Closed on
May 20, 2025
Sold by
Gerber Gregory L and Gerber Pamela S
Bought by
Gerber
Current Estimated Value
Purchase Details
Closed on
Dec 15, 2016
Bought by
Gerber Gregory L
Home Financials for this Owner
Home Financials are based on the most recent Mortgage that was taken out on this home.
Original Mortgage
$140,000
Interest Rate
4.16%
Purchase Details
Closed on
Oct 28, 1996
Sold by
King Don E and King Claudia T
Bought by
Gerber Sharilyn
Home Financials for this Owner
Home Financials are based on the most recent Mortgage that was taken out on this home.
Original Mortgage
$115,000
Interest Rate
8.11%
Purchase Details
Closed on
Sep 12, 1996
Sold by
Cardon Land Title Company
Bought by
King Don E and King Claudia T
Home Financials for this Owner
Home Financials are based on the most recent Mortgage that was taken out on this home.
Original Mortgage
$115,000
Interest Rate
8.11%
Create a Home Valuation Report for This Property
The Home Valuation Report is an in-depth analysis detailing your home's value as well as a comparison with similar homes in the area
Home Values in the Area
Average Home Value in this Area
Purchase History
| Date | Buyer | Sale Price | Title Company |
|---|---|---|---|
| Gerber | -- | Cottonwood Title | |
| Gerber Gregory L | -- | -- | |
| Gerber Sharilyn | -- | U S Title | |
| King Don E | -- | U S Title |
Source: Public Records
Mortgage History
| Date | Status | Borrower | Loan Amount |
|---|---|---|---|
| Previous Owner | Gerber Gregory L | $140,000 | |
| Previous Owner | Gerber Gregory L | -- | |
| Previous Owner | Gerber Sharilyn | $115,000 |
Source: Public Records
Tax History
| Year | Tax Paid | Tax Assessment Tax Assessment Total Assessment is a certain percentage of the fair market value that is determined by local assessors to be the total taxable value of land and additions on the property. | Land | Improvement |
|---|---|---|---|---|
| 2025 | $2,579 | $408,132 | $115,672 | $292,460 |
| 2024 | $2,516 | $401,000 | $115,673 | $285,327 |
| 2023 | $2,430 | $388,000 | $111,553 | $276,447 |
| 2022 | $2,694 | $245,850 | $53,792 | $192,058 |
| 2021 | $2,107 | $314,000 | $67,861 | $246,139 |
| 2020 | $1,941 | $265,000 | $67,861 | $197,139 |
| 2019 | $1,939 | $250,000 | $38,410 | $211,590 |
| 2018 | $1,914 | $233,000 | $34,569 | $198,431 |
| 2017 | $1,737 | $197,000 | $34,569 | $162,431 |
| 2016 | $1,659 | $101,011 | $18,553 | $82,458 |
| 2015 | $1,435 | $88,465 | $18,553 | $69,912 |
| 2014 | $1,353 | $81,836 | $15,708 | $66,128 |
Source: Public Records
Map
Nearby Homes
- 4248 S 2400 W
- 4297 Westlake Dr
- 4328 S 2175 W
- 4881 S 2400 W
- 4732 S West Park Dr
- 2815 W 4275 S
- 2038 W 4600 S
- 4220 S 2075 W
- 2778 W 4175 S Unit 237
- 4374 S 2900 W
- 2015 W 4225 S
- 4061 S 2175 W
- 2953 W 4650 S
- 4270 S 2900 W
- 4047 S 2175 W
- 2581 W 5000 S
- 4642 S 1900 W Unit 41
- 5024 S 2575 W
- 5007 S 2675 W
- 2979 W 4275 S
Your Personal Tour Guide
Ask me questions while you tour the home.