Estimated Value: $516,000 - $597,238
4
Beds
3
Baths
3,450
Sq Ft
$160/Sq Ft
Est. Value
About This Home
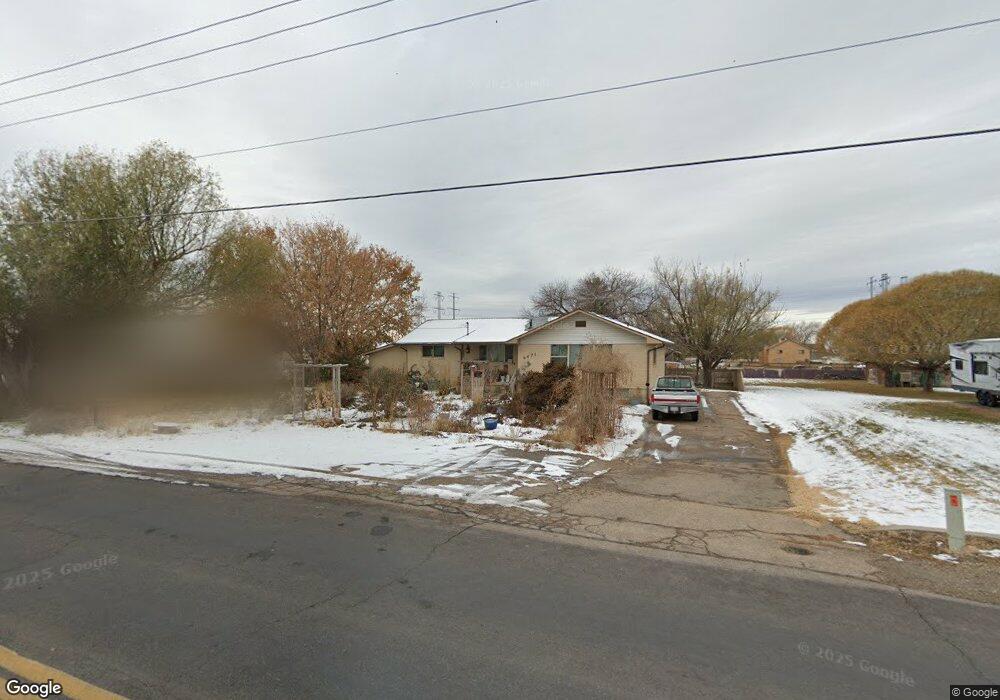
This home is located at 4471 S 3100 W, Roy, UT 84067 and is currently estimated at $551,310, approximately $159 per square foot. 4471 S 3100 W is a home located in Weber County with nearby schools including Midland School, Sand Ridge Junior High School, and Roy High School.
Ownership History
Date
Name
Owned For
Owner Type
Purchase Details
Closed on
May 23, 2011
Sold by
Federal Home Loan Mortgage Corporation
Bought by
Wilkinson Eric and Wilkinson Shannon
Current Estimated Value
Home Financials for this Owner
Home Financials are based on the most recent Mortgage that was taken out on this home.
Original Mortgage
$157,700
Outstanding Balance
$107,913
Interest Rate
4.55%
Mortgage Type
New Conventional
Estimated Equity
$443,397
Purchase Details
Closed on
Feb 8, 2011
Sold by
Parker W Brandon and Parker Casi
Bought by
Federal Home Loan Mortgage Corporation
Purchase Details
Closed on
Feb 26, 2007
Sold by
Parker W Brandon and Parker Casi
Bought by
Parker W Brandon and Parker Casi
Purchase Details
Closed on
Jan 19, 2007
Sold by
Parker Denise
Bought by
Parker W Brandon and Parker Casi
Create a Home Valuation Report for This Property
The Home Valuation Report is an in-depth analysis detailing your home's value as well as a comparison with similar homes in the area
Home Values in the Area
Average Home Value in this Area
Purchase History
| Date | Buyer | Sale Price | Title Company |
|---|---|---|---|
| Wilkinson Eric | -- | First American Union Heights | |
| Federal Home Loan Mortgage Corporation | $159,718 | Etitle Insurance Agency | |
| Parker W Brandon | -- | Accommodation | |
| Parker W Brandon | -- | Mountain View Title Ogden |
Source: Public Records
Mortgage History
| Date | Status | Borrower | Loan Amount |
|---|---|---|---|
| Open | Wilkinson Eric | $157,700 |
Source: Public Records
Tax History
| Year | Tax Paid | Tax Assessment Tax Assessment Total Assessment is a certain percentage of the fair market value that is determined by local assessors to be the total taxable value of land and additions on the property. | Land | Improvement |
|---|---|---|---|---|
| 2025 | $4,097 | $583,942 | $217,162 | $366,780 |
| 2024 | $3,973 | $574,997 | $217,162 | $357,835 |
| 2023 | $3,592 | $520,001 | $184,886 | $335,115 |
| 2022 | $3,557 | $524,000 | $156,897 | $367,103 |
| 2021 | $2,840 | $370,999 | $119,775 | $251,224 |
| 2020 | $2,834 | $347,000 | $119,775 | $227,225 |
| 2019 | $2,710 | $313,001 | $80,872 | $232,129 |
| 2018 | $2,584 | $282,999 | $75,150 | $207,849 |
| 2017 | $2,130 | $232,000 | $75,150 | $156,850 |
| 2016 | $1,910 | $117,122 | $44,550 | $72,572 |
| 2015 | $1,804 | $109,611 | $44,550 | $65,061 |
| 2014 | $1,766 | $105,589 | $44,550 | $61,039 |
Source: Public Records
Map
Nearby Homes
- 2979 W 4275 S
- 4435 Cross Creek Rd Unit 29C
- 4510 Stone Creek Rd Unit F
- 4374 S 2900 W
- 4491 Haven Creek Rd Unit A
- 4324 S 3350 W
- 4270 S 2900 W
- 2953 W 4650 S
- 4317 S 3350 W
- 3022 W 4750 S
- 2815 W 4275 S
- 4322 S 3450 W
- 3405 W 4525 S
- 4793 S 3025 W
- 4297 Westlake Dr
- 2778 W 4175 S Unit 237
- 4732 S West Park Dr
- 3610 W 4475 S
- 4891 S 2875 W
- 3511 W 4200 S
Your Personal Tour Guide
Ask me questions while you tour the home.