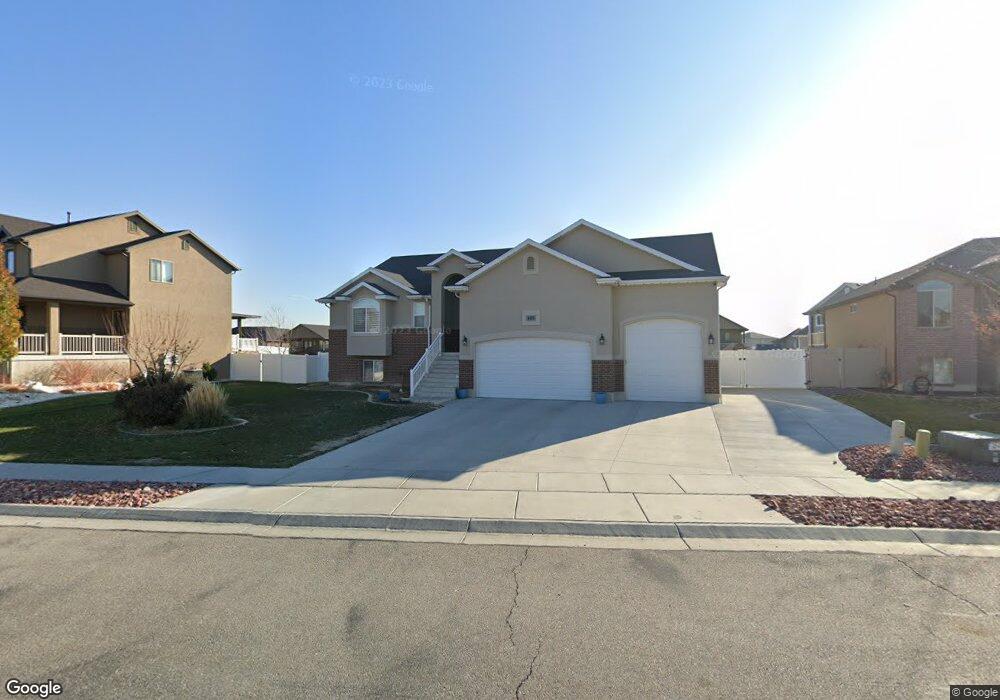
4471 W 5750 S Hooper, UT 84315
Estimated Value: $608,000 - $633,000
5
Beds
2
Baths
1,503
Sq Ft
$413/Sq Ft
Est. Value
About This Home
This home is located at 4471 W 5750 S, Hooper, UT 84315 and is currently estimated at $620,826, approximately $413 per square foot. 4471 W 5750 S is a home located in Weber County with nearby schools including Freedom School, Roy Junior High School, and Roy High School.
Ownership History
Date
Name
Owned For
Owner Type
Purchase Details
Closed on
Aug 26, 2014
Sold by
Garbanati Micah J and Garbanati Stefanie
Bought by
Garbanati Micah J and Garbanati Stefanie
Current Estimated Value
Home Financials for this Owner
Home Financials are based on the most recent Mortgage that was taken out on this home.
Original Mortgage
$278,863
Outstanding Balance
$213,251
Interest Rate
4.11%
Mortgage Type
New Conventional
Estimated Equity
$407,575
Purchase Details
Closed on
Apr 11, 2014
Sold by
Castle Creek Homes Llc
Bought by
Garbanati Micah J and Garbanati Stefanie
Home Financials for this Owner
Home Financials are based on the most recent Mortgage that was taken out on this home.
Original Mortgage
$281,420
Interest Rate
4.32%
Mortgage Type
Purchase Money Mortgage
Purchase Details
Closed on
Dec 16, 2013
Sold by
Cache Valley Bank
Bought by
Castle Creek Homes Llc
Purchase Details
Closed on
May 10, 2010
Sold by
Hooper 22 Llc
Bought by
Cache Valley Bank
Create a Home Valuation Report for This Property
The Home Valuation Report is an in-depth analysis detailing your home's value as well as a comparison with similar homes in the area
Home Values in the Area
Average Home Value in this Area
Purchase History
| Date | Buyer | Sale Price | Title Company |
|---|---|---|---|
| Garbanati Micah J | -- | Mountain View Title | |
| Garbanati Micah J | -- | Mountain View Title | |
| Castle Creek Homes Llc | -- | Cache Title Logan | |
| Cache Valley Bank | -- | Cache Title Logan |
Source: Public Records
Mortgage History
| Date | Status | Borrower | Loan Amount |
|---|---|---|---|
| Open | Garbanati Micah J | $278,863 | |
| Closed | Garbanati Micah J | $281,420 |
Source: Public Records
Tax History Compared to Growth
Tax History
| Year | Tax Paid | Tax Assessment Tax Assessment Total Assessment is a certain percentage of the fair market value that is determined by local assessors to be the total taxable value of land and additions on the property. | Land | Improvement |
|---|---|---|---|---|
| 2025 | $3,691 | $593,869 | $220,703 | $373,166 |
| 2024 | $3,563 | $320,649 | $121,386 | $199,263 |
| 2023 | $3,636 | $325,600 | $121,663 | $203,937 |
| 2022 | $3,522 | $323,950 | $97,083 | $226,867 |
| 2021 | $3,112 | $481,000 | $111,697 | $369,303 |
| 2020 | $2,781 | $393,000 | $96,903 | $296,097 |
| 2019 | $2,832 | $379,000 | $68,010 | $310,990 |
| 2018 | $2,676 | $341,000 | $68,010 | $272,990 |
| 2017 | $2,494 | $306,000 | $58,541 | $247,459 |
| 2016 | $2,257 | $148,348 | $32,303 | $116,045 |
| 2015 | $2,207 | $142,822 | $32,303 | $110,519 |
| 2014 | $624 | $42,928 | $42,928 | $0 |
Source: Public Records
Map
Nearby Homes
- 4471 W 5750 S Unit 13
- 4457 W 5750 S
- 4457 W 5750 S Unit 12
- 4485 W 5750 S
- 4485 W 5750 S Unit 14
- 4476 W 5775 S
- 4462 W 5775 S
- 4443 W 5750 S
- 4443 W 5750 S Unit 11
- 4499 W 5750 S
- 4499 W 5750 S Unit 15
- 4492 W 5775 S
- 4490 W 5750 S
- 4490 W 5750 S Unit 16
- 4450 W 5775 S
- 4474 W 5750 S
- 4474 W 5750 S Unit 17
- 4460 W 5750 S
- 4460 W 5750 S Unit 18
- 4429 W 5750 S