Estimated Value: $184,731 - $204,000
3
Beds
1
Bath
1,026
Sq Ft
$190/Sq Ft
Est. Value
About This Home
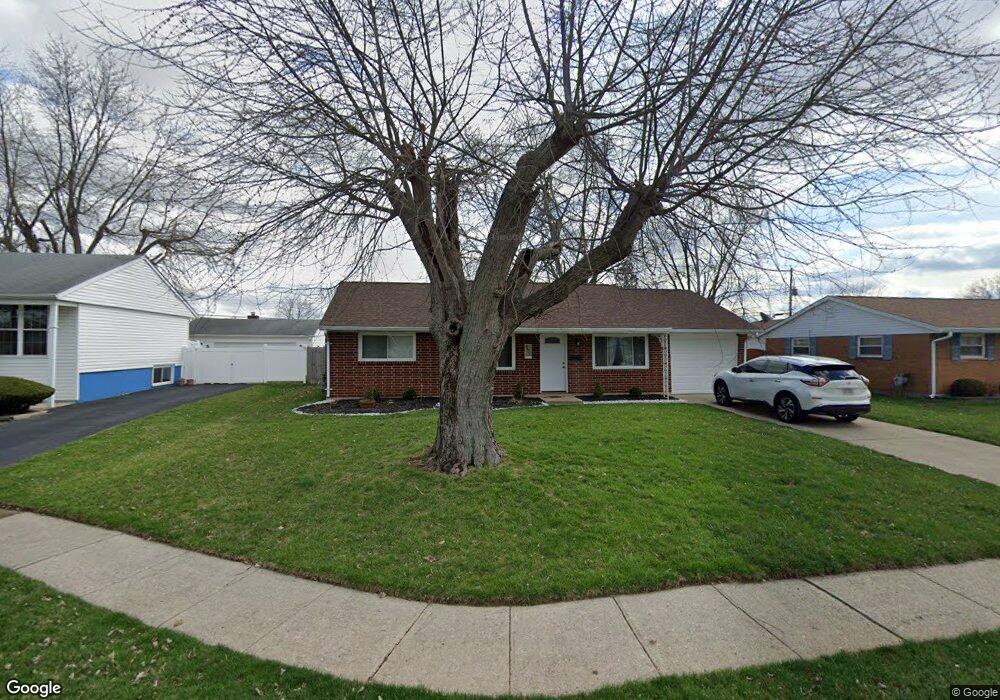
This home is located at 4472 Caddington St, Enon, OH 45323 and is currently estimated at $195,433, approximately $190 per square foot. 4472 Caddington St is a home located in Clark County with nearby schools including Greenon Elementary School, Greenon Jr. High School, and Greenon High School.
Ownership History
Date
Name
Owned For
Owner Type
Purchase Details
Closed on
Aug 14, 2020
Sold by
Evans James Edward and Evans Carolyn M
Bought by
Evans Kaleb Edward and Weingate Samantha Elizabeth
Current Estimated Value
Home Financials for this Owner
Home Financials are based on the most recent Mortgage that was taken out on this home.
Original Mortgage
$132,990
Interest Rate
2.9%
Mortgage Type
VA
Purchase Details
Closed on
Jun 27, 2019
Sold by
Madden Larry and Madden Anita
Bought by
Evans James Edward and Evans Carolyn M
Purchase Details
Closed on
May 20, 1999
Sold by
Finney Mary L
Bought by
Madden Larry and Madden Anita
Home Financials for this Owner
Home Financials are based on the most recent Mortgage that was taken out on this home.
Original Mortgage
$70,000
Interest Rate
6.92%
Mortgage Type
Balloon
Create a Home Valuation Report for This Property
The Home Valuation Report is an in-depth analysis detailing your home's value as well as a comparison with similar homes in the area
Home Values in the Area
Average Home Value in this Area
Purchase History
| Date | Buyer | Sale Price | Title Company |
|---|---|---|---|
| Evans Kaleb Edward | $130,000 | None Available | |
| Evans James Edward | $85,000 | None Available | |
| Madden Larry | $78,000 | -- |
Source: Public Records
Mortgage History
| Date | Status | Borrower | Loan Amount |
|---|---|---|---|
| Previous Owner | Evans Kaleb Edward | $132,990 | |
| Previous Owner | Madden Larry | $70,000 |
Source: Public Records
Tax History Compared to Growth
Tax History
| Year | Tax Paid | Tax Assessment Tax Assessment Total Assessment is a certain percentage of the fair market value that is determined by local assessors to be the total taxable value of land and additions on the property. | Land | Improvement |
|---|---|---|---|---|
| 2024 | $2,095 | $38,860 | $9,420 | $29,440 |
| 2023 | $2,095 | $38,860 | $9,420 | $29,440 |
| 2022 | $2,093 | $38,860 | $9,420 | $29,440 |
| 2021 | $1,953 | $32,130 | $6,980 | $25,150 |
| 2020 | $1,958 | $32,130 | $6,980 | $25,150 |
| 2019 | $1,984 | $32,130 | $6,980 | $25,150 |
| 2018 | $1,768 | $28,250 | $7,610 | $20,640 |
| 2017 | $1,791 | $25,740 | $7,613 | $18,127 |
| 2016 | $1,568 | $25,740 | $7,613 | $18,127 |
| 2015 | $1,442 | $24,886 | $7,613 | $17,273 |
| 2014 | $1,428 | $24,886 | $7,613 | $17,273 |
| 2013 | $1,274 | $24,886 | $7,613 | $17,273 |
Source: Public Records
Map
Nearby Homes
- 4441 S Xenia Dr
- 4538 Cynthia Dr
- 132 Green Vista Dr
- 6596 Oak Hill Dr
- 6861 Joseph Dr
- 806 Spring Lake Cir Unit 6
- 3729 Marion Dr
- 3644-3650 Charlotte Dr
- 111 Estelle Ave
- 3628-3642 Charlotte Dr
- 3611-3625 Charlotte Dr
- 2132 Willow Run Cir
- 5463 Enon-Xenia Rd
- 7581 Dayton Springfield Rd
- 62 Fay Dr
- 4772 Pheasanthill Ct
- 68 Skyline Dr
- 5540 Broadway Rd
- 6250 Fairfield Pike
- 7909 Court Ridge Ln
- 4486 Caddington St
- 4456 Caddington St
- 4473 S Xenia Dr
- 4473 Enon-Xenia Rd
- 4504 Caddington St
- 4485 S Xenia Dr
- 4461 S Xenia Dr
- 4473 Enon Xenia Pike
- 4485 Enon-Xenia Rd
- 6559 Pine Ridge Ave
- 4444 Caddington St
- 4507 S Xenia Dr
- 4441 Enon-Xenia Rd
- 4491 Caddington St
- 4473 Enon Xenia Pike
- 4522 Caddington St
- 6526 Pine Ridge Ave
- 4507 Caddington St
- 6554 Pine Ridge Ave
- 4523 S Xenia Dr