Estimated Value: $444,000 - $462,000
5
Beds
2
Baths
2,530
Sq Ft
$179/Sq Ft
Est. Value
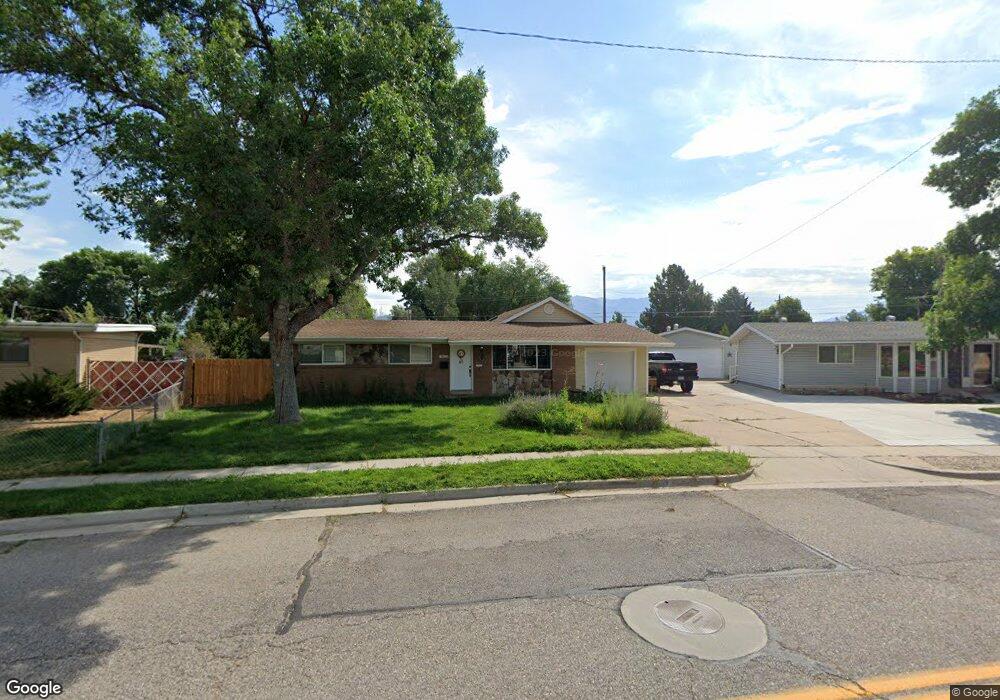
About This Home
This home is located at 4474 S 2450 W, Roy, UT 84067 and is currently estimated at $452,766, approximately $178 per square foot. 4474 S 2450 W is a home located in Weber County with nearby schools including Valley View School, Sand Ridge Junior High School, and Roy High School.
Ownership History
Date
Name
Owned For
Owner Type
Purchase Details
Closed on
Aug 9, 2021
Sold by
Munk Jeffery and Munk Averie
Bought by
Johnston Nicholas and Johnston Cayce
Current Estimated Value
Home Financials for this Owner
Home Financials are based on the most recent Mortgage that was taken out on this home.
Original Mortgage
$290,000
Outstanding Balance
$263,700
Interest Rate
2.9%
Mortgage Type
New Conventional
Estimated Equity
$189,066
Purchase Details
Closed on
Feb 20, 2019
Sold by
Munk Jeffery
Bought by
Munk Jeffery and Munk Averie
Home Financials for this Owner
Home Financials are based on the most recent Mortgage that was taken out on this home.
Original Mortgage
$215,200
Interest Rate
4.4%
Mortgage Type
New Conventional
Purchase Details
Closed on
Nov 2, 1999
Sold by
Karren Thayne S and Karren Jewel S
Bought by
Karren Jewel Ann Seamons and Karren Thayne Smith
Create a Home Valuation Report for This Property
The Home Valuation Report is an in-depth analysis detailing your home's value as well as a comparison with similar homes in the area
Home Values in the Area
Average Home Value in this Area
Purchase History
| Date | Buyer | Sale Price | Title Company |
|---|---|---|---|
| Johnston Nicholas | -- | Metro National Title | |
| Munk Jeffery | -- | First Amer Fashion Pointe | |
| Munk Jeffery | -- | Inwest Title West Haven | |
| Karren Jewel Ann Seamons | -- | -- |
Source: Public Records
Mortgage History
| Date | Status | Borrower | Loan Amount |
|---|---|---|---|
| Open | Johnston Nicholas | $290,000 | |
| Previous Owner | Munk Jeffery | $215,200 |
Source: Public Records
Tax History Compared to Growth
Tax History
| Year | Tax Paid | Tax Assessment Tax Assessment Total Assessment is a certain percentage of the fair market value that is determined by local assessors to be the total taxable value of land and additions on the property. | Land | Improvement |
|---|---|---|---|---|
| 2025 | $2,643 | $417,035 | $128,515 | $288,520 |
| 2024 | $2,580 | $225,497 | $70,683 | $154,814 |
| 2023 | $2,443 | $213,400 | $66,653 | $146,747 |
| 2022 | $2,863 | $261,250 | $57,335 | $203,915 |
| 2021 | $2,187 | $324,999 | $74,232 | $250,767 |
| 2020 | $2,078 | $284,000 | $74,232 | $209,768 |
| 2019 | $1,922 | $246,000 | $43,196 | $202,804 |
| 2018 | $1,864 | $225,000 | $38,921 | $186,079 |
| 2017 | $1,674 | $188,000 | $38,921 | $149,079 |
| 2016 | $1,601 | $96,585 | $19,926 | $76,659 |
| 2015 | $1,376 | $83,859 | $19,926 | $63,933 |
| 2014 | $1,361 | $82,039 | $17,039 | $65,000 |
Source: Public Records
Map
Nearby Homes