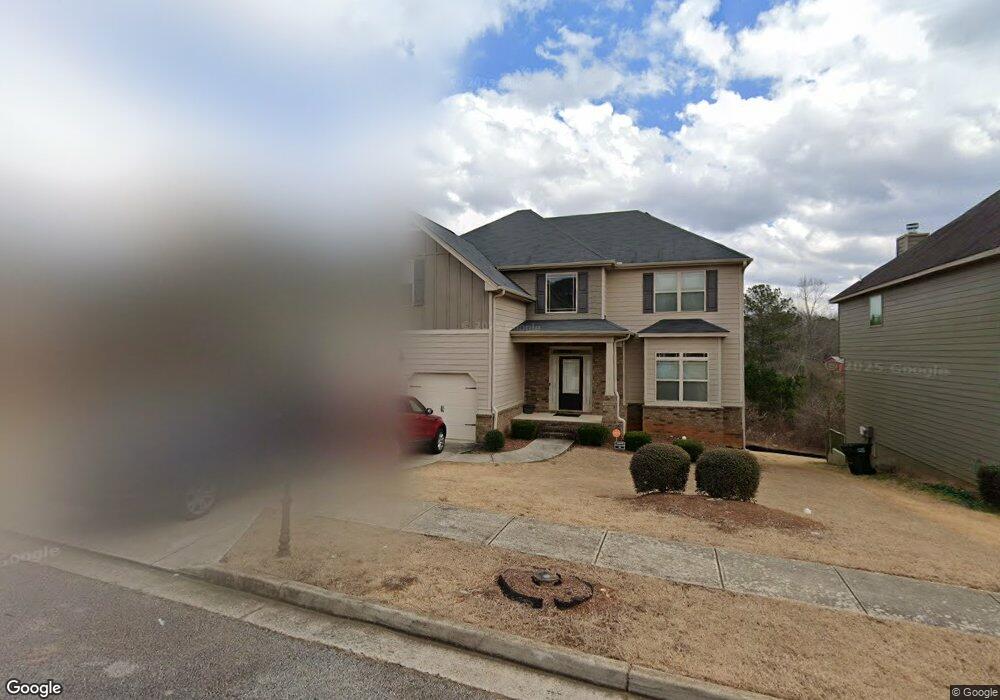
4474 Trellis View Ln Unit LOT 22 Loganville, GA 30052
Estimated Value: $406,654 - $460,000
4
Beds
3
Baths
3,002
Sq Ft
$143/Sq Ft
Est. Value
About This Home
This home is located at 4474 Trellis View Ln Unit LOT 22, Loganville, GA 30052 and is currently estimated at $430,414, approximately $143 per square foot. 4474 Trellis View Ln Unit LOT 22 is a home located in Gwinnett County with nearby schools including Rosebud Elementary School, Grace Snell Middle School, and South Gwinnett High School.
Ownership History
Date
Name
Owned For
Owner Type
Purchase Details
Closed on
Jan 12, 2017
Sold by
Focus Point Unlimited Llc
Bought by
Yingomome Eddy and Yingomone Jane
Current Estimated Value
Home Financials for this Owner
Home Financials are based on the most recent Mortgage that was taken out on this home.
Original Mortgage
$233,689
Outstanding Balance
$194,101
Interest Rate
4.4%
Mortgage Type
FHA
Estimated Equity
$236,313
Purchase Details
Closed on
Jun 24, 2015
Sold by
Davis Taurus D
Bought by
Focus Point Unlimited Llc
Purchase Details
Closed on
Jun 25, 2013
Sold by
Jefferson Homes Inc
Bought by
Davis Taurus D
Home Financials for this Owner
Home Financials are based on the most recent Mortgage that was taken out on this home.
Original Mortgage
$201,229
Interest Rate
3.25%
Mortgage Type
FHA
Purchase Details
Closed on
Jun 8, 2012
Sold by
Atlas Ga I Spe Llc
Bought by
Jefferson Homes Inc
Create a Home Valuation Report for This Property
The Home Valuation Report is an in-depth analysis detailing your home's value as well as a comparison with similar homes in the area
Home Values in the Area
Average Home Value in this Area
Purchase History
| Date | Buyer | Sale Price | Title Company |
|---|---|---|---|
| Yingomome Eddy | $238,000 | -- | |
| Focus Point Unlimited Llc | -- | -- | |
| Davis Taurus D | $204,943 | -- | |
| Jefferson Homes Inc | $51,000 | -- |
Source: Public Records
Mortgage History
| Date | Status | Borrower | Loan Amount |
|---|---|---|---|
| Open | Yingomome Eddy | $233,689 | |
| Previous Owner | Davis Taurus D | $201,229 |
Source: Public Records
Tax History Compared to Growth
Tax History
| Year | Tax Paid | Tax Assessment Tax Assessment Total Assessment is a certain percentage of the fair market value that is determined by local assessors to be the total taxable value of land and additions on the property. | Land | Improvement |
|---|---|---|---|---|
| 2024 | $5,404 | $193,880 | $30,000 | $163,880 |
| 2023 | $5,404 | $183,920 | $29,680 | $154,240 |
| 2022 | $4,468 | $149,800 | $24,000 | $125,800 |
| 2021 | $3,912 | $119,920 | $16,000 | $103,920 |
| 2020 | $3,842 | $115,400 | $16,000 | $99,400 |
| 2019 | $3,295 | $95,200 | $14,000 | $81,200 |
| 2018 | $3,298 | $95,200 | $14,000 | $81,200 |
| 2016 | $3,296 | $84,840 | $12,000 | $72,840 |
| 2015 | $3,021 | $84,840 | $12,000 | $72,840 |
| 2014 | -- | $77,480 | $12,000 | $65,480 |
Source: Public Records
Map
Nearby Homes
- 1892 Ivy View Walk
- 1906 Knight Cir
- 1735 Knight Cir
- 1826 Kingsmere Run Dr
- 1866 Kingsmere Run Dr
- 1846 Kingsmere Run Dr
- 1836 Kingsmere Run Dr
- 1836 Kingsmere Run Dr Unit LOT 6
- 1816 Kingsmere Run Dr
- 1797 Kingsmere Run Dr
- Wellington Plan at Kingsmere Estates
- Leighton Plan at Kingsmere Estates
- Clifton Plan at Kingsmere Estates
- 719 Sara Meadow Rd
- 4385 Foxberry Run
- 4306 Foxberry Run
- 2167 Pixie Rose Ln
- 4107 Rosebud Rd
- 4474 Trellis View Ln
- 4484 Trellis View Ln
- 4464 Trellis View Ln
- 1903 Trellis View Ln
- 0 Trellis View Ln Unit 8629683
- 0 Trellis View Ln Unit 8231860
- 0 Trellis View Ln Unit 7642159
- 0 Trellis View Ln Unit 7321336
- 0 Trellis View Ln Unit 3259986
- 0 Trellis View Ln
- 1823 Ivy View Walk
- 4494 Trellis View Ln
- 4494 Trellis View Ln Unit LOT 24
- 1833 Ivy View Walk
- 4465 Trellis View Ln
- 4465 Trellis View Ln Unit LOT 34
- 4485 Trellis View Ln
- 4495 Trellis View Ln
- 4504 Trellis View Ln
- 4504 Trellis View Ln Unit LOT 25