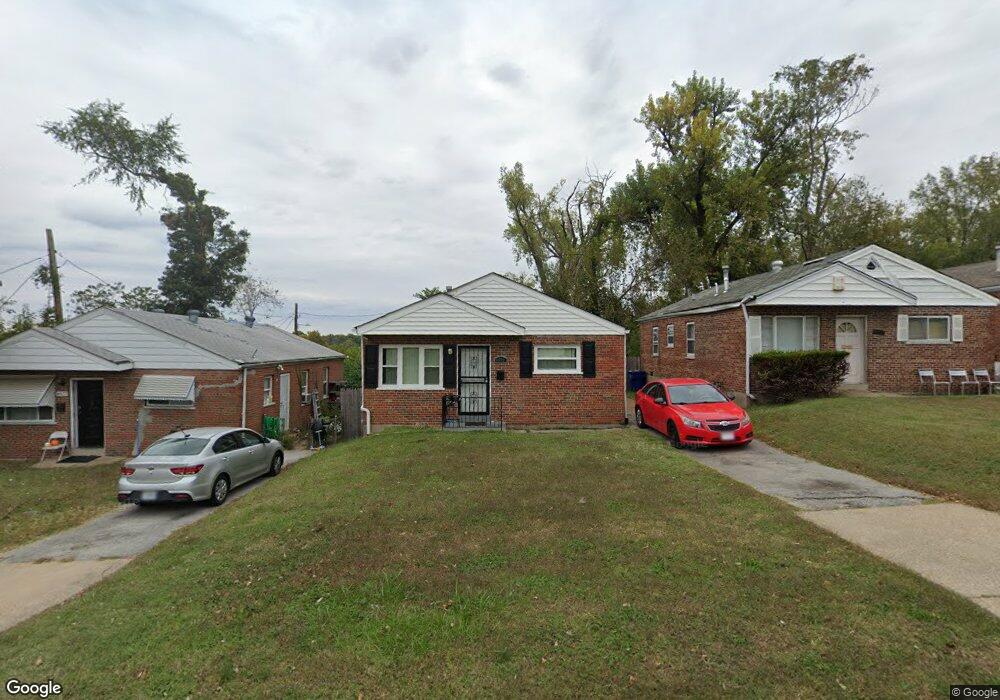
4475 Anderson Ave Saint Louis, MO 63115
Penrose NeighborhoodEstimated Value: $54,000 - $86,000
--
Bed
1
Bath
1,810
Sq Ft
$39/Sq Ft
Est. Value
About This Home
This home is located at 4475 Anderson Ave, Saint Louis, MO 63115 and is currently estimated at $70,209, approximately $38 per square foot. 4475 Anderson Ave is a home located in St. Louis City with nearby schools including Ashland Elementary School, Yeatman-Liddell Middle School, and Vashon High School.
Ownership History
Date
Name
Owned For
Owner Type
Purchase Details
Closed on
Jul 23, 2015
Sold by
Curry Carmen N and Adams Carmen N
Bought by
Curry Carmen N and Curry Courtland C
Current Estimated Value
Purchase Details
Closed on
Dec 7, 2006
Sold by
Boure Carmen and Bourne Dexter
Bought by
Bourne Carmen
Home Financials for this Owner
Home Financials are based on the most recent Mortgage that was taken out on this home.
Original Mortgage
$46,800
Interest Rate
6.19%
Mortgage Type
Stand Alone Refi Refinance Of Original Loan
Purchase Details
Closed on
Dec 29, 2005
Sold by
Boure Carmen
Bought by
Boure Dexter and Boure Carmen
Purchase Details
Closed on
Jul 28, 2000
Sold by
Gaddis Mildred A
Bought by
Adams Carmen N and Adams Carmen
Home Financials for this Owner
Home Financials are based on the most recent Mortgage that was taken out on this home.
Original Mortgage
$32,299
Interest Rate
8.15%
Mortgage Type
FHA
Create a Home Valuation Report for This Property
The Home Valuation Report is an in-depth analysis detailing your home's value as well as a comparison with similar homes in the area
Home Values in the Area
Average Home Value in this Area
Purchase History
| Date | Buyer | Sale Price | Title Company |
|---|---|---|---|
| Curry Carmen N | -- | None Available | |
| Bourne Carmen | -- | None Available | |
| Boure Dexter | $32,000 | -- | |
| Adams Carmen N | -- | -- |
Source: Public Records
Mortgage History
| Date | Status | Borrower | Loan Amount |
|---|---|---|---|
| Closed | Bourne Carmen | $46,800 | |
| Closed | Adams Carmen N | $32,299 |
Source: Public Records
Tax History Compared to Growth
Tax History
| Year | Tax Paid | Tax Assessment Tax Assessment Total Assessment is a certain percentage of the fair market value that is determined by local assessors to be the total taxable value of land and additions on the property. | Land | Improvement |
|---|---|---|---|---|
| 2025 | $333 | $3,770 | $360 | $3,410 |
| 2024 | $318 | $3,640 | $360 | $3,280 |
| 2023 | $318 | $3,640 | $360 | $3,280 |
| 2022 | $323 | $3,570 | $360 | $3,210 |
| 2021 | $323 | $3,570 | $360 | $3,210 |
| 2020 | $320 | $3,570 | $360 | $3,210 |
| 2019 | $319 | $3,570 | $360 | $3,210 |
| 2018 | $319 | $3,460 | $360 | $3,100 |
| 2017 | $314 | $3,460 | $360 | $3,100 |
| 2016 | $404 | $4,480 | $720 | $3,760 |
| 2015 | $368 | $4,480 | $720 | $3,760 |
| 2014 | $444 | $4,480 | $720 | $3,760 |
| 2013 | -- | $5,490 | $720 | $4,770 |
Source: Public Records
Map
Nearby Homes
- 4449 Anderson Ave
- 4477 Bessie Ave
- 4246 N Taylor Ave
- 4418 Dryden Ave
- 4556 Carter Ave
- 4499 Lee Ave Unit B
- 4627 Korte Ave
- 4607 Lee Ave
- 4402 Clarence Ave
- 4253 Holly Ave
- 4237 Holly Ave
- 4419 Holly Ave
- 4655 Lee Ave
- 4429 Farlin Ave
- 4608 Pope Ave
- 4610 Pope Ave
- 4430 Sexauer Ave
- 4629 Farlin Ave
- 4450 Holly Ave
- 3003 TAYOR N Taylor Ave
- 4471 Anderson Ave
- 4469 Anderson Ave
- 4467 Anderson Ave
- 4477 Anderson Ave
- 4472 Anderson Ave
- 4476 Anderson Ave
- 4468 Anderson Ave
- 4480 Anderson Ave
- 4306 N Taylor Ave
- 4312 N Taylor Ave
- 4318 N Taylor Ave
- 4300 N Taylor Ave
- 4482 Anderson Ave
- 4324 N Taylor Ave
- 4484 Anderson Ave
- 4330 N Taylor Ave
- 4458 Anderson Ave
- 4460 Anderson Ave
- 4486 Anderson Ave
- 4336 N Taylor Ave