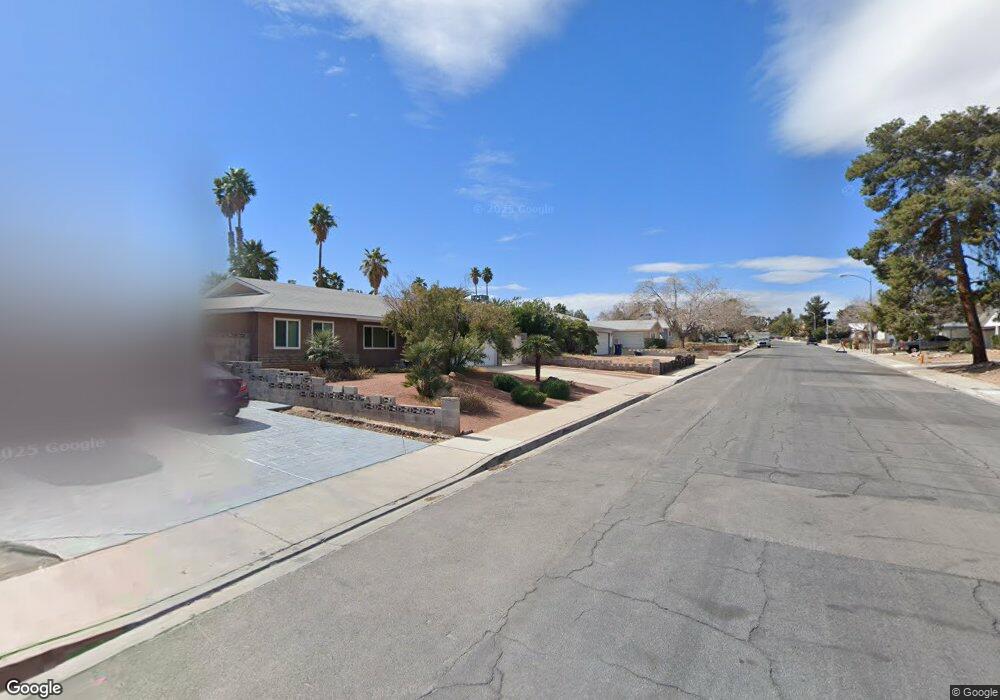
4475 El Como Way Las Vegas, NV 89121
Paradise Valley East NeighborhoodEstimated Value: $413,000 - $435,000
3
Beds
2
Baths
1,620
Sq Ft
$260/Sq Ft
Est. Value
About This Home
This home is located at 4475 El Como Way, Las Vegas, NV 89121 and is currently estimated at $421,922, approximately $260 per square foot. 4475 El Como Way is a home located in Clark County with nearby schools including J.M. Ullom Elementary School, C.W. Woodbury Middle School, and Chaparral High School.
Ownership History
Date
Name
Owned For
Owner Type
Purchase Details
Closed on
Nov 12, 2014
Sold by
Gopez Mary E
Bought by
Gopez Craig M
Current Estimated Value
Home Financials for this Owner
Home Financials are based on the most recent Mortgage that was taken out on this home.
Original Mortgage
$189,894
Outstanding Balance
$146,000
Interest Rate
4.1%
Mortgage Type
VA
Estimated Equity
$275,922
Purchase Details
Closed on
Aug 16, 2008
Sold by
Thomas Elwin Leo and Jolley Sharon Thomas
Bought by
Gopez Craig M and Gopez Mary E
Home Financials for this Owner
Home Financials are based on the most recent Mortgage that was taken out on this home.
Original Mortgage
$198,171
Interest Rate
6.5%
Mortgage Type
VA
Purchase Details
Closed on
Jan 14, 2007
Sold by
Thomas Elwin Leo
Bought by
Thomas Elwin Leo and Elwin Leo Thomas Sr Trust
Create a Home Valuation Report for This Property
The Home Valuation Report is an in-depth analysis detailing your home's value as well as a comparison with similar homes in the area
Home Values in the Area
Average Home Value in this Area
Purchase History
| Date | Buyer | Sale Price | Title Company |
|---|---|---|---|
| Gopez Craig M | $116,149 | Boston National Title | |
| Gopez Craig M | $194,000 | North American Title Main | |
| Thomas Elwin Leo | -- | None Available |
Source: Public Records
Mortgage History
| Date | Status | Borrower | Loan Amount |
|---|---|---|---|
| Open | Gopez Craig M | $189,894 | |
| Previous Owner | Gopez Craig M | $198,171 |
Source: Public Records
Tax History Compared to Growth
Tax History
| Year | Tax Paid | Tax Assessment Tax Assessment Total Assessment is a certain percentage of the fair market value that is determined by local assessors to be the total taxable value of land and additions on the property. | Land | Improvement |
|---|---|---|---|---|
| 2025 | $1,186 | $58,998 | $28,000 | $30,998 |
| 2024 | $1,099 | $58,998 | $28,000 | $30,998 |
| 2023 | $732 | $61,658 | $32,200 | $29,458 |
| 2022 | $1,018 | $55,615 | $27,650 | $27,965 |
| 2021 | $943 | $51,875 | $24,500 | $27,375 |
| 2020 | $872 | $51,382 | $23,450 | $27,932 |
| 2019 | $818 | $48,557 | $20,300 | $28,257 |
| 2018 | $780 | $46,416 | $18,550 | $27,866 |
| 2017 | $1,341 | $45,712 | $16,800 | $28,912 |
| 2016 | $732 | $42,449 | $12,250 | $30,199 |
| 2015 | $729 | $40,652 | $10,500 | $30,152 |
| 2014 | $706 | $27,607 | $6,300 | $21,307 |
Source: Public Records
Map
Nearby Homes
- 4567 Dennis Way
- 4457 Rita Dr
- 4462 Newton Dr
- 4332 Del Santos Dr
- 4310 El Antonio Place
- 4655 Bennett Dr
- 4458 El Quinta Ct
- 4285 El Como Way
- 4845 S Mountain Vista St
- 4356 Powell Ave
- 4754 Marnell Dr
- 4606 Powell Ave
- 4625 La Fonda Dr
- 4278 El Campana Way
- 4161 Oxnard Cir
- 4345 Quay Ct Unit 5
- 4269 Cartegena Way
- 4727 Conrad St
- 4274 Gibraltar St
- 4356 Sabadell St
- 4463 El Como Way
- 4485 El Como Way
- 4474 Dennis Way
- 4484 Dennis Way
- 4464 Dennis Way
- 4453 El Como Way
- 4495 El Como Way
- 4476 El Como Way
- 4494 Dennis Way
- 4464 El Como Way
- 4486 El Como Way
- 4454 Dennis Way
- 4443 El Como Way
- 4507 El Como Way
- 4454 El Como Way
- 4496 El Como Way
- 4504 Dennis Way
- 4444 Dennis Way
- 4477 Dennis Way
- 4475 El Cebra Way