Estimated Value: $477,000 - $538,000
2
Beds
1
Bath
2,004
Sq Ft
$256/Sq Ft
Est. Value
About This Home
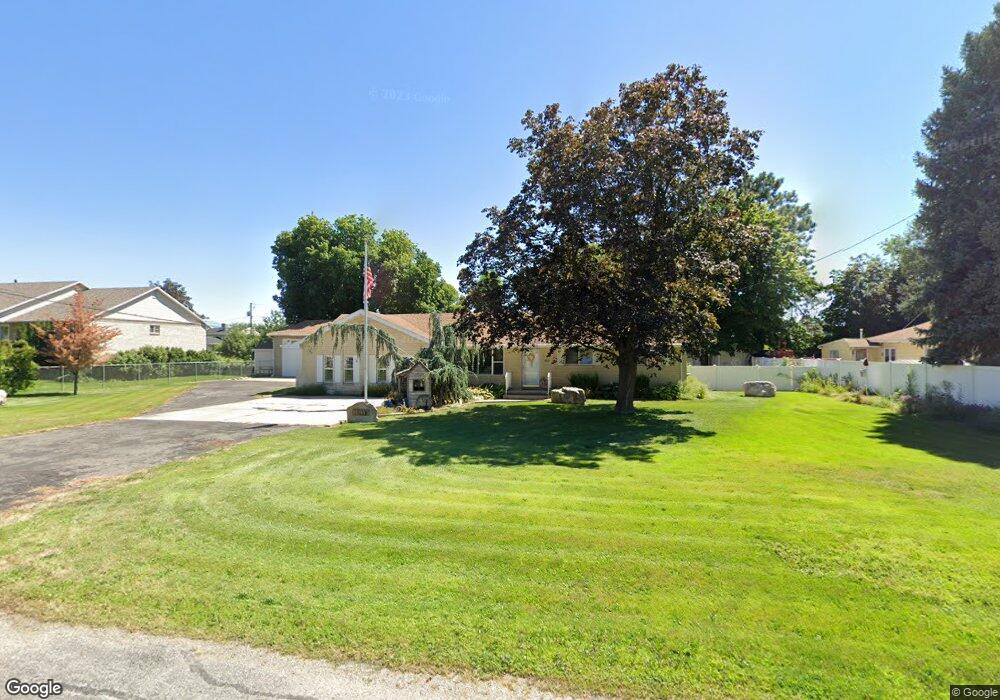
This home is located at 4475 W 2275 N, Ogden, UT 84404 and is currently estimated at $513,079, approximately $256 per square foot. 4475 W 2275 N is a home located in Weber County with nearby schools including Plain City School, Wahlquist Junior High School, and Fremont High School.
Ownership History
Date
Name
Owned For
Owner Type
Purchase Details
Closed on
Oct 20, 2022
Sold by
Brown Virl A
Bought by
Virl A And Janice Brown Revocable Living Trus
Current Estimated Value
Purchase Details
Closed on
Mar 7, 2018
Sold by
Hales Jeff W
Bought by
Brown Virl A and Brown Janice D
Home Financials for this Owner
Home Financials are based on the most recent Mortgage that was taken out on this home.
Original Mortgage
$250,000
Interest Rate
4.15%
Mortgage Type
New Conventional
Purchase Details
Closed on
Jan 30, 2018
Sold by
Kapp Mary S
Bought by
Hales Jeff W
Home Financials for this Owner
Home Financials are based on the most recent Mortgage that was taken out on this home.
Original Mortgage
$250,000
Interest Rate
4.15%
Mortgage Type
New Conventional
Purchase Details
Closed on
Dec 11, 2002
Sold by
Kapp Leon N and Kapp Mary S
Bought by
Kapp Leon N
Create a Home Valuation Report for This Property
The Home Valuation Report is an in-depth analysis detailing your home's value as well as a comparison with similar homes in the area
Home Values in the Area
Average Home Value in this Area
Purchase History
| Date | Buyer | Sale Price | Title Company |
|---|---|---|---|
| Virl A And Janice Brown Revocable Living Trus | -- | -- | |
| Brown Virl A | -- | Mountain View Title | |
| Hales Jeff W | -- | Mountain View Title | |
| Kapp Leon N | -- | -- |
Source: Public Records
Mortgage History
| Date | Status | Borrower | Loan Amount |
|---|---|---|---|
| Previous Owner | Brown Virl A | $250,000 |
Source: Public Records
Tax History
| Year | Tax Paid | Tax Assessment Tax Assessment Total Assessment is a certain percentage of the fair market value that is determined by local assessors to be the total taxable value of land and additions on the property. | Land | Improvement |
|---|---|---|---|---|
| 2025 | $2,649 | $461,373 | $159,225 | $302,148 |
| 2024 | $2,520 | $249,698 | $87,571 | $162,127 |
| 2023 | $2,288 | $224,400 | $79,310 | $145,090 |
| 2022 | $2,510 | $257,400 | $76,293 | $181,107 |
| 2021 | $2,148 | $365,999 | $67,707 | $298,292 |
| 2020 | $2,077 | $326,000 | $57,471 | $268,529 |
| 2019 | $1,994 | $293,999 | $51,921 | $242,078 |
| 2018 | $2,018 | $286,000 | $51,921 | $234,079 |
| 2017 | $1,747 | $230,000 | $45,461 | $184,539 |
| 2016 | $1,745 | $126,477 | $22,595 | $103,882 |
| 2015 | $1,517 | $104,452 | $22,595 | $81,857 |
| 2014 | $1,421 | $94,877 | $23,697 | $71,180 |
Source: Public Records
Map
Nearby Homes
- 4236 W 2200 N
- 2131 N 4650 W
- 1980 N 4650 W
- 2752 W 2775 N Unit 150
- 2746 W 2775 N Unit 149
- 4479 W 1650 N
- 2316 N 3825 W
- 4494 W 1600 N
- 4096 W 1725 N
- 1862 N 3900 W
- 3782 W 2100 N
- 3855 W 2600 N
- 4188 W 2875 N
- 2255 N 3600 St W Unit 21
- 3940 2800 North St
- 3057 N 3325 W
- 3065 N 3325 W
- 3319 W North Plain City Rd
- 2994 W 1975 N
- 3152 N 3450 W
Your Personal Tour Guide
Ask me questions while you tour the home.