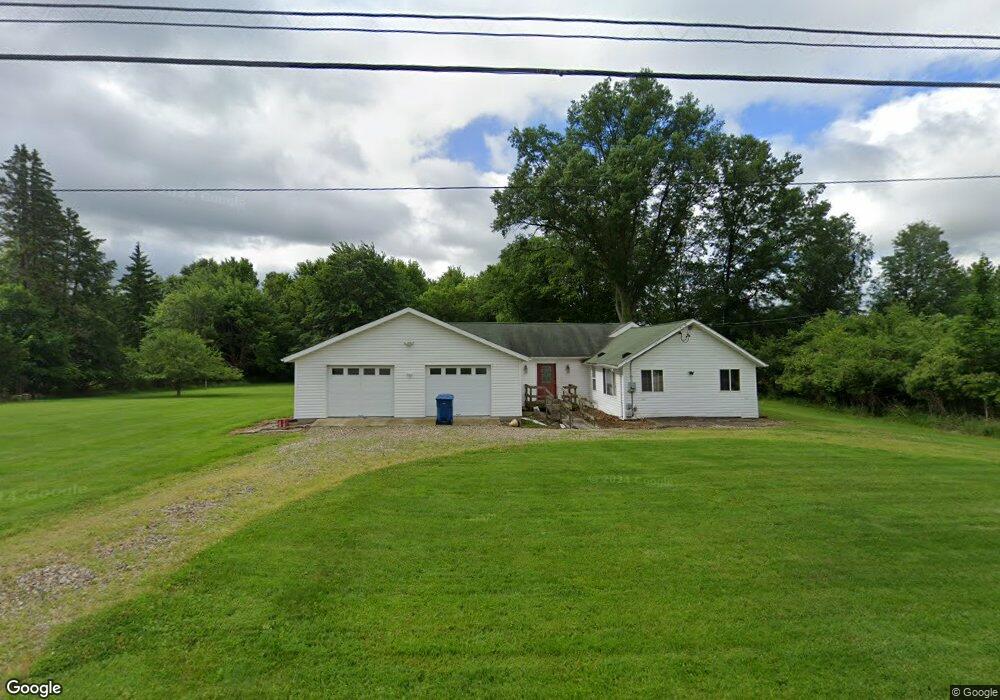
4476 Johnson Rd Norton, OH 44203
Hametown NeighborhoodEstimated Value: $179,000 - $253,467
1
Bed
1
Bath
2,034
Sq Ft
$106/Sq Ft
Est. Value
About This Home
This home is located at 4476 Johnson Rd, Norton, OH 44203 and is currently estimated at $215,117, approximately $105 per square foot. 4476 Johnson Rd is a home located in Summit County with nearby schools including Norton Primary Elementary School, Norton Middle School, and Norton High School.
Ownership History
Date
Name
Owned For
Owner Type
Purchase Details
Closed on
Jun 15, 2021
Sold by
Bickley Doni and Conway Erin
Bought by
Conway Erin G
Current Estimated Value
Purchase Details
Closed on
Nov 15, 2018
Sold by
King Faith C and King William
Bought by
Bickley Doni and Bickley Erin
Home Financials for this Owner
Home Financials are based on the most recent Mortgage that was taken out on this home.
Original Mortgage
$141,839
Outstanding Balance
$126,708
Interest Rate
5.62%
Mortgage Type
FHA
Estimated Equity
$88,409
Purchase Details
Closed on
Jun 15, 2018
Sold by
Estate Of June L Conway
Bought by
King Faith C and Bickley Erin
Purchase Details
Closed on
Jun 29, 2004
Sold by
Dombroski Richard W and Dombroski William
Bought by
Conway James A and Conway June L
Home Financials for this Owner
Home Financials are based on the most recent Mortgage that was taken out on this home.
Original Mortgage
$67,925
Interest Rate
4.87%
Mortgage Type
Purchase Money Mortgage
Create a Home Valuation Report for This Property
The Home Valuation Report is an in-depth analysis detailing your home's value as well as a comparison with similar homes in the area
Home Values in the Area
Average Home Value in this Area
Purchase History
| Date | Buyer | Sale Price | Title Company |
|---|---|---|---|
| Conway Erin G | -- | None Available | |
| Bickley Doni | -- | None Available | |
| King Faith C | -- | None Available | |
| Conway James A | $71,500 | Midland Commerce Group |
Source: Public Records
Mortgage History
| Date | Status | Borrower | Loan Amount |
|---|---|---|---|
| Open | Bickley Doni | $141,839 | |
| Previous Owner | Conway James A | $67,925 |
Source: Public Records
Tax History
| Year | Tax Paid | Tax Assessment Tax Assessment Total Assessment is a certain percentage of the fair market value that is determined by local assessors to be the total taxable value of land and additions on the property. | Land | Improvement |
|---|---|---|---|---|
| 2024 | $2,982 | $68,069 | $16,349 | $51,720 |
| 2023 | $2,982 | $68,069 | $16,349 | $51,720 |
| 2022 | $2,679 | $49,865 | $11,935 | $37,930 |
| 2021 | $2,553 | $49,865 | $11,935 | $37,930 |
| 2020 | $2,393 | $49,870 | $11,940 | $37,930 |
| 2019 | $2,150 | $39,360 | $11,100 | $28,260 |
| 2018 | $2,115 | $39,360 | $11,100 | $28,260 |
| 2017 | $1,348 | $39,360 | $11,100 | $28,260 |
| 2016 | $2,240 | $38,190 | $11,100 | $27,090 |
| 2015 | $1,348 | $22,980 | $11,100 | $11,880 |
| 2014 | $1,335 | $22,980 | $11,100 | $11,880 |
| 2013 | $1,392 | $24,220 | $11,100 | $13,120 |
Source: Public Records
Map
Nearby Homes
- 9894 Silvercreek Rd
- 442 Madison Trail
- 4059 Knollbrook Dr
- 4527 Rock Cut Rd
- 910 Devonwood Dr
- 15240 Hametown Rd
- 902 Devonwood Dr
- 593 Silvercrest Rd
- 3626 Johnson Rd
- 695 Hillcrest Dr
- V/L 1050 Melanie Ln
- V/L approx 67.56ac Gates St
- 233 Homan Dr
- 136 Taylor Rd
- VL 1067 Homan Dr
- 255 Taylor Rd
- 497 Gates St
- 683 Whippoorwill Ln
- 595 Jessica Ln
- 1537 Wooster Rd W
- 4458 Johnson Rd
- 4477 Johnson Rd
- 4457 Johnson Rd
- 4467 Johnson Rd
- 4434 Johnson Rd
- 4511 Johnson Rd
- 4525 Johnson Rd
- 4418 Johnson Rd
- 4404 Johnson Rd
- 4412 Johnson Rd
- 4549 Johnson Rd
- 4394 Johnson Rd
- 4410 Johnson Rd
- 4410 Johnson Rd
- 4410 Johnson Rd
- 4410 Johnson Rd
- 4384 Johnson Rd
- 4563 Johnson Rd
- 4374 Johnson Rd
- 4581 Johnson Rd
Your Personal Tour Guide
Ask me questions while you tour the home.