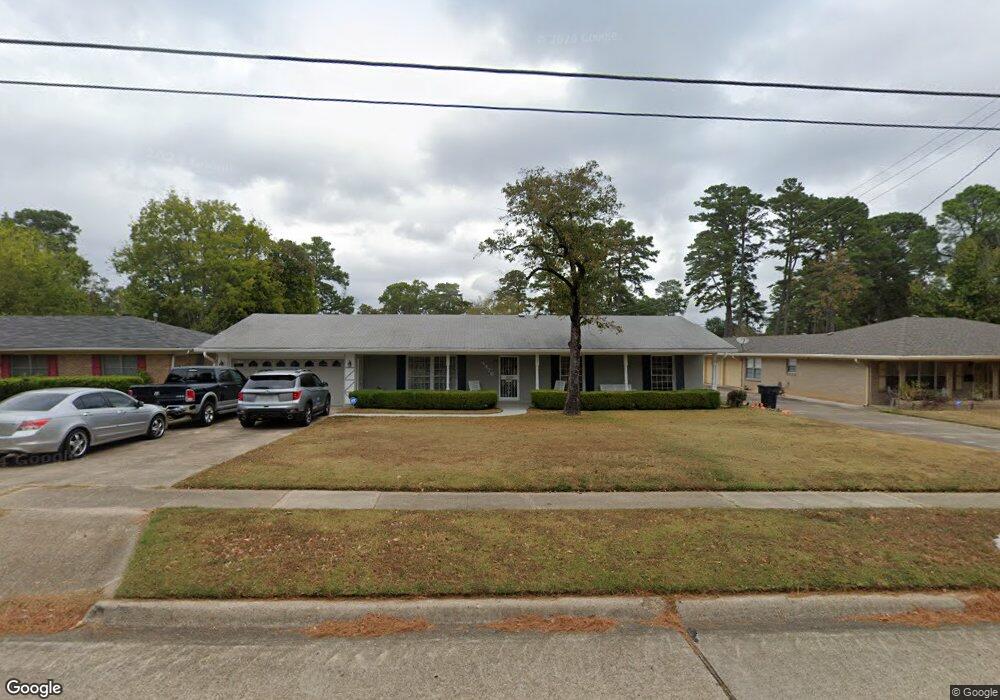
4476 Lakeshore Dr Shreveport, LA 71109
Country Club Hills-Lakeshore NeighborhoodEstimated Value: $45,000 - $47,626
2
Beds
1
Bath
1,135
Sq Ft
$40/Sq Ft
Est. Value
About This Home
This home is located at 4476 Lakeshore Dr, Shreveport, LA 71109 and is currently estimated at $45,907, approximately $40 per square foot. 4476 Lakeshore Dr is a home located in Caddo Parish with nearby schools including Judson Fundamental Elementary School, South Highlands Elementary, and Fairfield Magnet School.
Ownership History
Date
Name
Owned For
Owner Type
Purchase Details
Closed on
Jun 21, 2024
Sold by
91Houses Llc
Bought by
Sojourn Land And Resort Llc
Current Estimated Value
Home Financials for this Owner
Home Financials are based on the most recent Mortgage that was taken out on this home.
Original Mortgage
$50,000,000
Outstanding Balance
$49,361,931
Interest Rate
7.02%
Mortgage Type
Credit Line Revolving
Estimated Equity
-$49,316,024
Purchase Details
Closed on
Sep 8, 2020
Sold by
Bertolla Trust
Bought by
91Houses Llc
Purchase Details
Closed on
Aug 27, 2015
Sold by
Belcher Investments Llc
Bought by
Bertolla Denny L
Purchase Details
Closed on
Aug 20, 2015
Sold by
Belcher Investments Llc
Bought by
Bertolla Denny L
Purchase Details
Closed on
Aug 12, 2015
Sold by
Johnson James Rodney and Pickens Johnson Mary Bell
Bought by
Belcher Investments Llc
Create a Home Valuation Report for This Property
The Home Valuation Report is an in-depth analysis detailing your home's value as well as a comparison with similar homes in the area
Home Values in the Area
Average Home Value in this Area
Purchase History
| Date | Buyer | Sale Price | Title Company |
|---|---|---|---|
| Sojourn Land And Resort Llc | $217,000 | None Listed On Document | |
| 91Houses Llc | $1,500,000 | Fidelity National Title | |
| Bertolla Denny L | $6,500 | None Available | |
| Bertolla Denny L | $6,500 | None Available | |
| Belcher Investments Llc | $6,500 | None Available |
Source: Public Records
Mortgage History
| Date | Status | Borrower | Loan Amount |
|---|---|---|---|
| Open | Sojourn Land And Resort Llc | $50,000,000 |
Source: Public Records
Tax History Compared to Growth
Tax History
| Year | Tax Paid | Tax Assessment Tax Assessment Total Assessment is a certain percentage of the fair market value that is determined by local assessors to be the total taxable value of land and additions on the property. | Land | Improvement |
|---|---|---|---|---|
| 2024 | $373 | $2,395 | $457 | $1,938 |
| 2023 | $378 | $2,373 | $435 | $1,938 |
| 2022 | $378 | $2,373 | $435 | $1,938 |
| 2021 | $372 | $2,373 | $435 | $1,938 |
| 2020 | $372 | $2,373 | $435 | $1,938 |
| 2019 | $398 | $2,464 | $435 | $2,029 |
| 2018 | $317 | $2,464 | $435 | $2,029 |
| 2017 | $405 | $2,464 | $435 | $2,029 |
| 2015 | $187 | $1,440 | $440 | $1,000 |
| 2014 | $188 | $1,440 | $440 | $1,000 |
| 2013 | -- | $1,440 | $440 | $1,000 |
Source: Public Records
Map
Nearby Homes
- 2531 Lakeway Ct
- 2605 Lakeway Dr
- 2415 Lakecrest Dr
- 2932 Independence Ave
- 4171 Lakeshore Dr
- LOT 1 Angel Oaks
- 2711 Thayer St
- 3841 Catherine St
- 1613 Dilg League Dr
- 3936 Eileen Ln
- 5414 Briarcliff Cir
- 5337 S Lakeshore Dr
- 4018 Golf Links Blvd
- 3832 Claiborne Ave
- 3850 Lisa Ln
- 0 Oakcrest St
- 3636 Milton St
- 4031 Robin Ln
- 3802 Eileen Ln
- 3619 Stonewall St
- 4476 Lakeshore Dr
- 4472 Lakeshore Dr
- 4480 Lakeshore Dr
- 4468 Lakeshore Dr
- 4468 Lakeshore Dr
- 4468 Lakeshore Dr
- 4468 Lakeshore Dr
- 4468 Lakeshore Dr
- 4468 Lakeshore Dr
- 4468 Lakeshore Dr
- 4468 Lakeshore Dr
- 4468 Lakeshore Dr
- 4468 Lakeshore Dr
- 4468 Lakeshore Dr
- 4468 Lakeshore Dr
- 4468 Lakeshore Dr
- 4468 Lakeshore Dr
- 4468 Lakeshore Dr
- 4468 Lakeshore Dr
- 4468 Lakeshore Dr