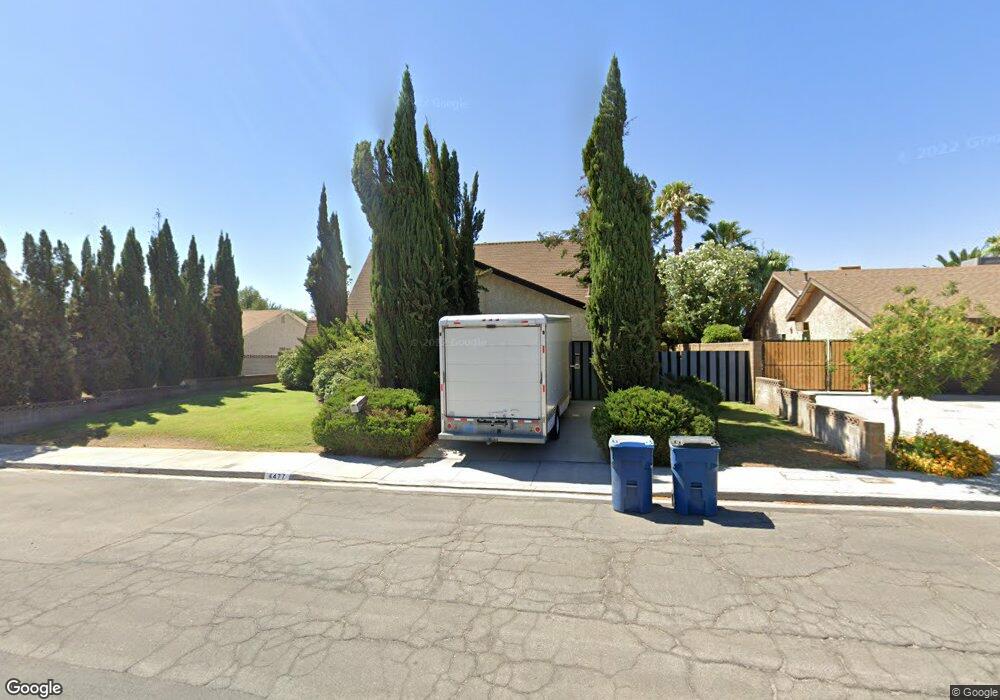
4477 El Campana Way Las Vegas, NV 89121
Paradise Valley East NeighborhoodEstimated Value: $455,885 - $510,000
5
Beds
3
Baths
2,373
Sq Ft
$205/Sq Ft
Est. Value
About This Home
This home is located at 4477 El Campana Way, Las Vegas, NV 89121 and is currently estimated at $486,971, approximately $205 per square foot. 4477 El Campana Way is a home located in Clark County with nearby schools including William E. Ferron Elementary School, C.W. Woodbury Middle School, and Chaparral High School.
Ownership History
Date
Name
Owned For
Owner Type
Purchase Details
Closed on
Oct 29, 2009
Sold by
Singer Clifford H and Tan Lifang
Bought by
Clifford H Singer Revocable Trust
Current Estimated Value
Purchase Details
Closed on
May 19, 2004
Sold by
Mantanona Joseph T and Mantanona Teresita M
Bought by
Singer Clifford H and Tan Lifang
Home Financials for this Owner
Home Financials are based on the most recent Mortgage that was taken out on this home.
Original Mortgage
$230,000
Outstanding Balance
$103,039
Interest Rate
4.87%
Estimated Equity
$383,933
Purchase Details
Closed on
Sep 5, 2003
Sold by
Anzai Bert H and Anzai Diane Y
Bought by
Mantanona Joseph T and Mantanona Teresita M
Home Financials for this Owner
Home Financials are based on the most recent Mortgage that was taken out on this home.
Original Mortgage
$187,150
Interest Rate
6.06%
Mortgage Type
Unknown
Purchase Details
Closed on
Dec 3, 1993
Sold by
Anzai Bert H and Anzai Diane Y
Bought by
Anzai Bert H and Anzai Diane Y
Create a Home Valuation Report for This Property
The Home Valuation Report is an in-depth analysis detailing your home's value as well as a comparison with similar homes in the area
Home Values in the Area
Average Home Value in this Area
Purchase History
| Date | Buyer | Sale Price | Title Company |
|---|---|---|---|
| Clifford H Singer Revocable Trust | -- | None Available | |
| Singer Clifford H | $306,500 | -- | |
| Mantanona Joseph T | $197,000 | Fidelity National Title | |
| Anzai Bert H | -- | -- | |
| Anzai Bert H | -- | -- | |
| Anzai Bert H | -- | -- | |
| Anzai Bert H | -- | -- |
Source: Public Records
Mortgage History
| Date | Status | Borrower | Loan Amount |
|---|---|---|---|
| Open | Singer Clifford H | $230,000 | |
| Previous Owner | Mantanona Joseph T | $187,150 | |
| Closed | Singer Clifford H | $25,000 |
Source: Public Records
Tax History Compared to Growth
Tax History
| Year | Tax Paid | Tax Assessment Tax Assessment Total Assessment is a certain percentage of the fair market value that is determined by local assessors to be the total taxable value of land and additions on the property. | Land | Improvement |
|---|---|---|---|---|
| 2025 | $1,265 | $68,563 | $31,150 | $37,413 |
| 2024 | $1,229 | $68,563 | $31,150 | $37,413 |
| 2023 | $1,229 | $72,397 | $36,750 | $35,647 |
| 2022 | $1,193 | $65,320 | $31,500 | $33,820 |
| 2021 | $1,159 | $58,933 | $25,900 | $33,033 |
| 2020 | $1,122 | $58,919 | $25,200 | $33,719 |
| 2019 | $1,089 | $57,268 | $23,100 | $34,168 |
| 2018 | $1,058 | $55,208 | $21,700 | $33,508 |
| 2017 | $1,555 | $53,010 | $18,200 | $34,810 |
| 2016 | $1,003 | $48,494 | $12,250 | $36,244 |
| 2015 | $1,000 | $45,956 | $10,500 | $35,456 |
| 2014 | $969 | $41,699 | $6,300 | $35,399 |
Source: Public Records
Map
Nearby Homes
- 4458 El Quinta Ct
- 4356 Powell Ave
- 4606 Powell Ave
- 4274 Gibraltar St
- 4625 La Fonda Dr
- 4278 El Campana Way
- 4269 Cartegena Way
- 4356 Sabadell St
- 4165 Grace St
- 4165 Santa Terrasa Place
- 4567 Dennis Way
- 4813 Plata Del Sol Dr
- 4285 El Como Way
- 4300 Don Quixote St
- 4310 El Antonio Place
- 4754 Marnell Dr
- 4533 Charles Ronald Ave
- 4332 Del Santos Dr
- 4078 Gold Coast Dr
- 4785 San Sebastian Ave
- 4489 El Campana Way
- 4467 El Campana Way
- 4494 Powell Ave
- 4484 Powell Ave
- 4457 El Campana Way
- 4501 El Campana Way
- 4506 Powell Ave
- 4474 Powell Ave
- 4476 El Campana Way
- 4486 El Campana Way
- 4466 El Campana Way
- 4498 El Campana Way
- 4516 Powell Ave
- 4511 El Campana Way
- 4462 Powell Ave
- 4456 El Campana Way
- 4508 El Campana Way
- 4497 Powell Ave
- 4487 Powell Ave Unit 4C
- 4349 Salamanca Cir