Estimated Value: $471,000 - $527,391
6
Beds
4
Baths
3,617
Sq Ft
$140/Sq Ft
Est. Value
About This Home
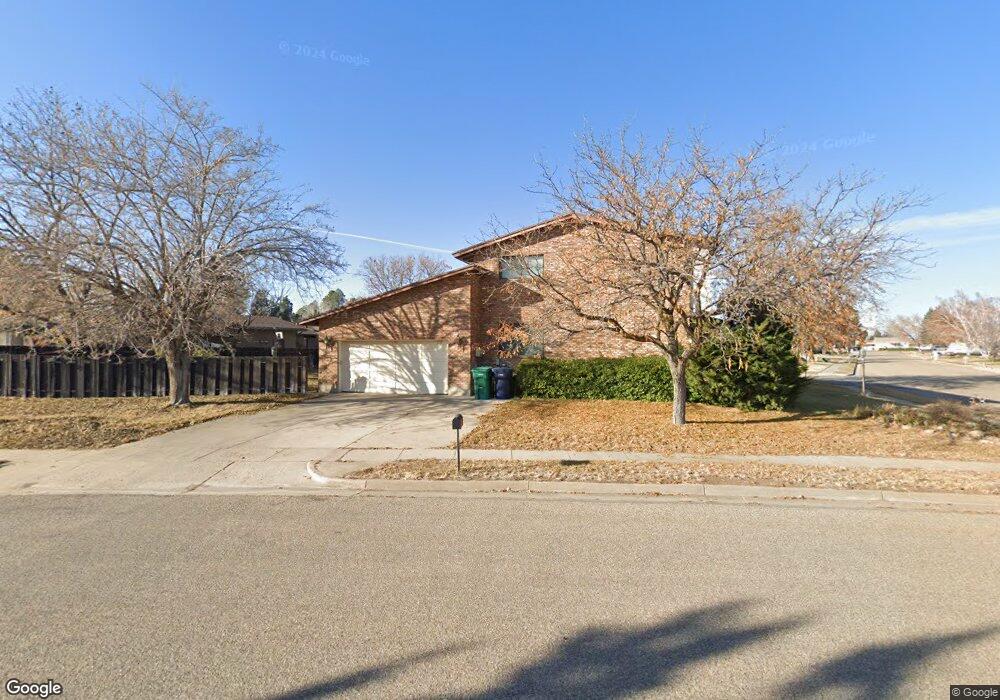
This home is located at 4477 S 2300 W, Roy, UT 84067 and is currently estimated at $505,098, approximately $139 per square foot. 4477 S 2300 W is a home located in Weber County with nearby schools including Valley View School, Sand Ridge Junior High School, and Roy High School.
Ownership History
Date
Name
Owned For
Owner Type
Purchase Details
Closed on
Aug 30, 2019
Sold by
Lechtenberg Norman Ray and Lechtenberg Ranae
Bought by
Lechtenberg Norman Ray and Lechtenberg Ranae
Current Estimated Value
Purchase Details
Closed on
Jun 21, 2000
Sold by
Manufacturers & Traders Trust Company
Bought by
Lechtenberg Norman Ray and Lechtenberg Ranae
Purchase Details
Closed on
Jan 13, 2000
Sold by
Fresh Rex M and Fresh Pauline
Bought by
Manufacturers & Traders Trust Company
Create a Home Valuation Report for This Property
The Home Valuation Report is an in-depth analysis detailing your home's value as well as a comparison with similar homes in the area
Home Values in the Area
Average Home Value in this Area
Purchase History
| Date | Buyer | Sale Price | Title Company |
|---|---|---|---|
| Lechtenberg Norman Ray | -- | None Available | |
| Lechtenberg Norman Ray | -- | First American Title | |
| Manufacturers & Traders Trust Company | $170,000 | Backman Stewart Title |
Source: Public Records
Tax History
| Year | Tax Paid | Tax Assessment Tax Assessment Total Assessment is a certain percentage of the fair market value that is determined by local assessors to be the total taxable value of land and additions on the property. | Land | Improvement |
|---|---|---|---|---|
| 2025 | $3,166 | $511,754 | $152,855 | $358,899 |
| 2024 | $3,090 | $276,649 | $84,070 | $192,579 |
| 2023 | $3,009 | $270,050 | $83,585 | $186,465 |
| 2022 | $2,942 | $270,600 | $58,643 | $211,957 |
| 2021 | $2,451 | $371,000 | $71,154 | $299,846 |
| 2020 | $2,165 | $299,000 | $71,154 | $227,846 |
| 2019 | $2,072 | $269,000 | $41,514 | $227,486 |
| 2018 | $1,966 | $240,000 | $38,476 | $201,524 |
| 2017 | $2,028 | $234,000 | $38,476 | $195,524 |
| 2016 | $1,821 | $112,136 | $18,168 | $93,968 |
| 2015 | $1,634 | $102,559 | $18,168 | $84,391 |
| 2014 | $1,639 | $101,861 | $18,168 | $83,693 |
Source: Public Records
Map
Nearby Homes
- 4328 S 2175 W
- 2038 W 4600 S
- 4248 S 2400 W
- 4220 S 2075 W
- 2015 W 4225 S
- 4881 S 2400 W
- 4642 S 1900 W Unit 41
- 4061 S 2175 W
- 4297 Westlake Dr
- 4047 S 2175 W
- 4602 Hathaway Dr
- 4732 S West Park Dr
- 4598 S Blossom Glen Way
- 2815 W 4275 S
- 5024 S 2575 W
- 2581 W 5000 S
- 1959 3985 St S Unit 2
- 2778 W 4175 S Unit 237
- 1838 W 5050 S
- 1829 W 5050 S
Your Personal Tour Guide
Ask me questions while you tour the home.