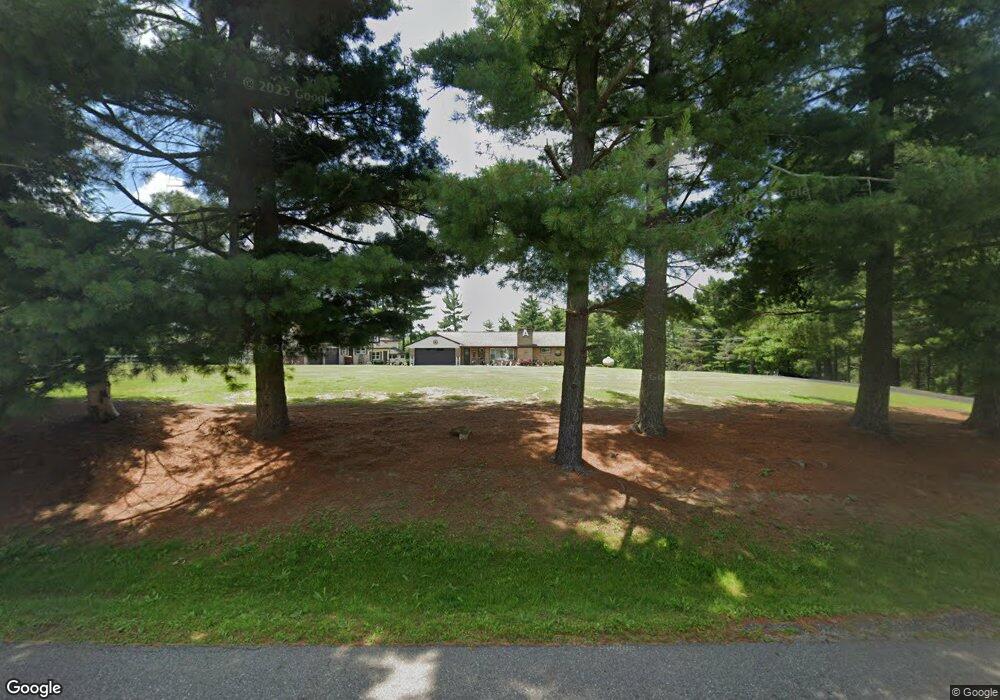
4478 New Cumberland Rd NE Mineral City, OH 44656
Estimated Value: $235,000 - $319,000
3
Beds
2
Baths
1,260
Sq Ft
$231/Sq Ft
Est. Value
About This Home
This home is located at 4478 New Cumberland Rd NE, Mineral City, OH 44656 and is currently estimated at $290,781, approximately $230 per square foot. 4478 New Cumberland Rd NE is a home located in Tuscarawas County with nearby schools including Tuscarawas Valley Primary School, Tuscarawas Valley Intermediate School, and Tuscarawas Valley Middle School.
Ownership History
Date
Name
Owned For
Owner Type
Purchase Details
Closed on
Oct 22, 2007
Sold by
Investment Source Ltd
Bought by
Archer Richard D and Archer Vicky J
Current Estimated Value
Home Financials for this Owner
Home Financials are based on the most recent Mortgage that was taken out on this home.
Original Mortgage
$100,000
Outstanding Balance
$17,388
Interest Rate
6.5%
Mortgage Type
Purchase Money Mortgage
Estimated Equity
$273,393
Purchase Details
Closed on
Apr 26, 2007
Sold by
Menegay Richard L
Bought by
Investment Source Ltd
Purchase Details
Closed on
Oct 27, 1997
Sold by
Brace Roy D
Bought by
Menegay Richard L and Menegay Jeanette
Home Financials for this Owner
Home Financials are based on the most recent Mortgage that was taken out on this home.
Original Mortgage
$146,260
Interest Rate
7.65%
Mortgage Type
VA
Create a Home Valuation Report for This Property
The Home Valuation Report is an in-depth analysis detailing your home's value as well as a comparison with similar homes in the area
Home Values in the Area
Average Home Value in this Area
Purchase History
| Date | Buyer | Sale Price | Title Company |
|---|---|---|---|
| Archer Richard D | $139,000 | Tusc Title | |
| Investment Source Ltd | $93,500 | None Available | |
| Menegay Richard L | $142,000 | -- |
Source: Public Records
Mortgage History
| Date | Status | Borrower | Loan Amount |
|---|---|---|---|
| Open | Archer Richard D | $100,000 | |
| Previous Owner | Menegay Richard L | $146,260 |
Source: Public Records
Tax History Compared to Growth
Tax History
| Year | Tax Paid | Tax Assessment Tax Assessment Total Assessment is a certain percentage of the fair market value that is determined by local assessors to be the total taxable value of land and additions on the property. | Land | Improvement |
|---|---|---|---|---|
| 2024 | $2,800 | $68,310 | $12,360 | $55,950 |
| 2023 | $2,800 | $195,150 | $35,300 | $159,850 |
| 2022 | $2,804 | $68,303 | $12,355 | $55,948 |
| 2021 | $2,487 | $58,888 | $13,647 | $45,241 |
| 2020 | $2,487 | $58,888 | $13,647 | $45,241 |
| 2019 | $2,504 | $58,888 | $13,647 | $45,241 |
| 2018 | $2,243 | $49,700 | $11,520 | $38,180 |
| 2017 | $2,264 | $49,700 | $11,520 | $38,180 |
| 2016 | $2,239 | $49,700 | $11,520 | $38,180 |
| 2014 | $2,241 | $46,960 | $8,650 | $38,310 |
| 2013 | $1,786 | $46,960 | $8,650 | $38,310 |
Source: Public Records
Map
Nearby Homes
- 9035 N Shore Dr NE
- 6056 Johnstown Rd NE
- 9156 Cherry Ln NE
- 9248 Lakewood Dr NE
- 0 Magnolia Rd Unit 5164982
- 0 Magnolia Rd Unit 5164979
- 2258 Laurel Dr
- 3340 Lombardy Rd SW
- 1223 New Cumberland Rd NE
- 1201 Whispering Pines Ln SW Unit 12
- 9366 Briar Rd Unit 20
- 2010 Lakewood Rd SW
- 6234 Riggle Hill Rd NE
- 0 Cutler Rd NE Unit 5156445
- 0 Cutler Rd NE Unit 5156452
- 0 Cutler Rd NE Unit 5156457
- 5903 Maher Rd
- 853 Hartwood Rd NW
- 1147 Hope Rd NW
- 6285 Adams Rd NE
- 4471 New Cumberland Rd NE
- 4529 New Cumberland Rd NE
- 4595 New Cumberland Rd NE
- 8226 Lakeview Rd NE
- 4296 New Cumberland Rd NE
- 4641 New Cumberland Rd NE
- 4668 New Cumberland Rd NE
- 4267 New Cumberland Rd NE
- 8277 Lakeview Rd NE
- 8277 Lakeview Rd NE
- 4683 New Cumberland Rd NE
- 8294 Lakeview Rd NE
- 4749 New Cumberland Rd NE
- 4762 New Cumberland Rd NE
- 4633 New Cumberland Rd NE
- 4161 New Cumberland Rd NE
- 4891 East St NE
- 4792 New Cumberland Rd NE
- 4816 New Cumberland Rd NE
- 4120 New Cumberland Rd NE