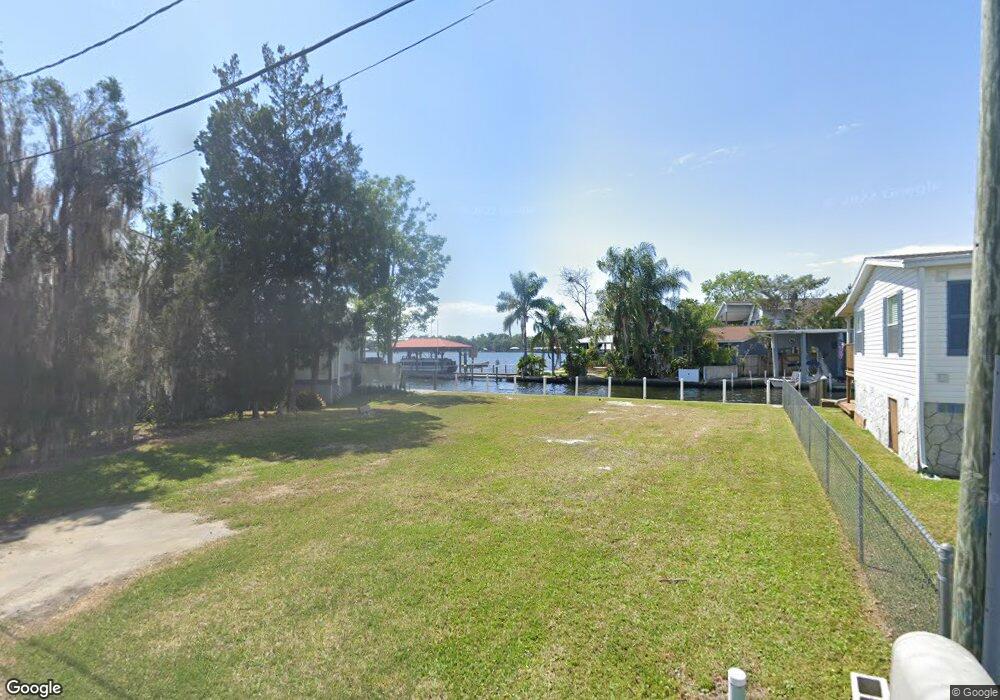
4479 S Capecove Loop Homosassa, FL 34448
Estimated Value: $442,588 - $554,000
3
Beds
1
Bath
1,064
Sq Ft
$464/Sq Ft
Est. Value
About This Home
This home is located at 4479 S Capecove Loop, Homosassa, FL 34448 and is currently estimated at $493,897, approximately $464 per square foot. 4479 S Capecove Loop is a home located in Citrus County with nearby schools including Homosassa Elementary School, Crystal River High School, and Crystal River Middle School.
Ownership History
Date
Name
Owned For
Owner Type
Purchase Details
Closed on
Jul 11, 2018
Sold by
Wills Paul E and Wills Marsha A
Bought by
Granger Robert C
Current Estimated Value
Purchase Details
Closed on
Jul 6, 2007
Sold by
Batson Robert E
Bought by
Wills Paul E and Wills Marsha A
Home Financials for this Owner
Home Financials are based on the most recent Mortgage that was taken out on this home.
Original Mortgage
$166,000
Interest Rate
6.37%
Mortgage Type
Purchase Money Mortgage
Purchase Details
Closed on
Apr 2, 2004
Sold by
Trisel Mollie S and Crumpler Arlene J
Bought by
Batson Robert E
Home Financials for this Owner
Home Financials are based on the most recent Mortgage that was taken out on this home.
Original Mortgage
$137,000
Interest Rate
5.98%
Mortgage Type
Purchase Money Mortgage
Purchase Details
Closed on
Mar 1, 2004
Bought by
Wills Paul E and Wills Marsha A
Home Financials for this Owner
Home Financials are based on the most recent Mortgage that was taken out on this home.
Original Mortgage
$137,000
Interest Rate
5.98%
Mortgage Type
Purchase Money Mortgage
Create a Home Valuation Report for This Property
The Home Valuation Report is an in-depth analysis detailing your home's value as well as a comparison with similar homes in the area
Home Values in the Area
Average Home Value in this Area
Purchase History
| Date | Buyer | Sale Price | Title Company |
|---|---|---|---|
| Granger Robert C | $140,000 | Land Title | |
| Wills Paul E | $226,000 | Land Title Insurance Of Citr | |
| Batson Robert E | $177,000 | Land Title Insurance Of Citr | |
| Wills Paul E | $100 | -- |
Source: Public Records
Mortgage History
| Date | Status | Borrower | Loan Amount |
|---|---|---|---|
| Previous Owner | Wills Paul E | $166,000 | |
| Previous Owner | Batson Robert E | $137,000 |
Source: Public Records
Tax History Compared to Growth
Tax History
| Year | Tax Paid | Tax Assessment Tax Assessment Total Assessment is a certain percentage of the fair market value that is determined by local assessors to be the total taxable value of land and additions on the property. | Land | Improvement |
|---|---|---|---|---|
| 2024 | $5,751 | $400,777 | $111,250 | $289,527 |
| 2023 | $5,751 | $373,015 | $110,880 | $262,135 |
| 2022 | $4,931 | $311,537 | $110,880 | $200,657 |
| 2021 | $4,384 | $270,577 | $110,880 | $159,697 |
| 2020 | $1,785 | $112,290 | $110,880 | $1,410 |
| 2019 | $1,810 | $112,380 | $110,880 | $1,500 |
| 2018 | $563 | $78,210 | $76,620 | $1,590 |
| 2017 | $644 | $71,984 | $66,640 | $5,344 |
| 2016 | $1,526 | $123,167 | $87,526 | $35,641 |
| 2015 | $1,510 | $122,311 | $87,526 | $34,785 |
| 2014 | $2,146 | $121,340 | $87,030 | $34,310 |
Source: Public Records
Map
Nearby Homes
- 10258 W Blue Springs Ct
- 10245 W Blue Springs Ct
- 10285 W Blue Springs Ct
- 10348 W Twin River Ln
- 10125 W Halls River Rd
- 10039 W Halls River Rd
- 10234 W Middleburg Loop Unit 152
- 10209 W Waterlander Unit 164
- 4441 S Lewoods Dr
- 10357 W Hein Trail Unit 127
- 10200 W Waterlander Loop
- 9828 W Marva Ct
- 4110 S Jefferson Point
- 4843 S Acree Point
- 4600 S Lewoods Dr
- 9600 W Fishbowl Dr
- 4330 S Conwell Point
- 4204 S Purslane Dr
- 4367 S Conwell Point
- 10684 W Halls River Rd Unit 2
- 4479 S Cape Cove Loop
- 4483 S Capecove Loop
- 4452 S Capecove Loop
- 4487 S Capecove Loop
- 4450 S Capecove Loop
- 4450 S Capecove Loop Unit 25
- 10302 W Port Ct
- 10304 W Port Ct
- 4469 S Capecove Loop
- 10301 W Port Ct
- 4493 S Capecove Loop
- 4432 S Capecove Loop
- 4476 S Capecove Loop
- 4453 S Capecove Loop
- 4459 S Capecove Loop
- 10308 W Port Ct
- 4463 S Capecove Loop
- 4449 S Capecove Loop
- 4431 S Capecove Loop