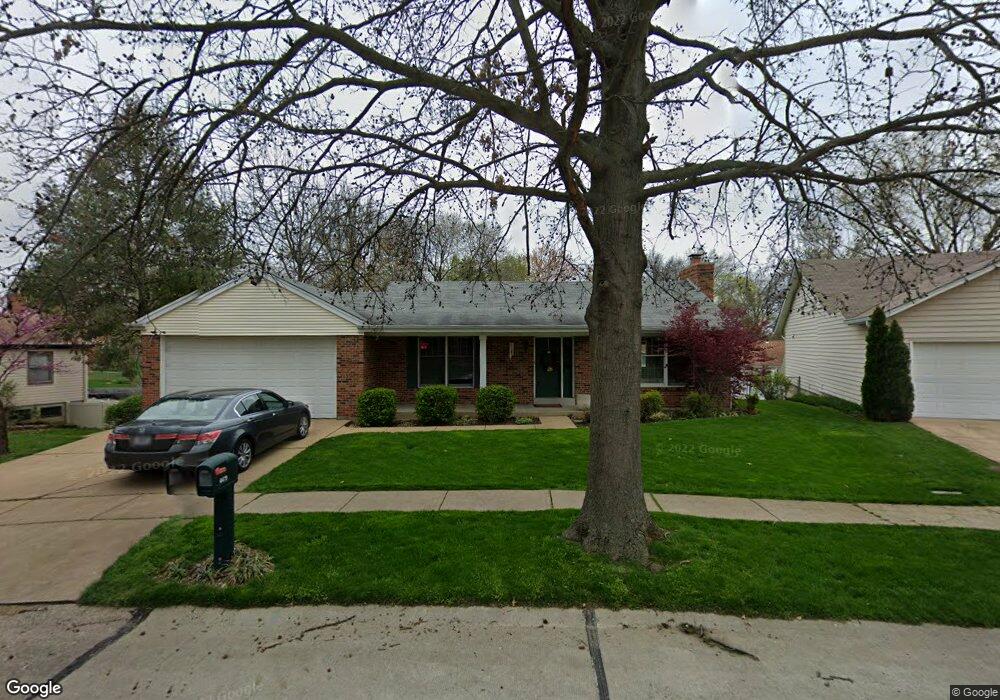
4479 Sunhill Dr Saint Louis, MO 63128
Estimated Value: $360,744 - $397,000
4
Beds
3
Baths
1,704
Sq Ft
$224/Sq Ft
Est. Value
About This Home
This home is located at 4479 Sunhill Dr, Saint Louis, MO 63128 and is currently estimated at $381,936, approximately $224 per square foot. 4479 Sunhill Dr is a home located in St. Louis County with nearby schools including Trautwein Elementary School, Washington Middle School, and Mehlville High School.
Ownership History
Date
Name
Owned For
Owner Type
Purchase Details
Closed on
Apr 10, 2013
Sold by
The Lindenbusch Living Trust
Bought by
Bosslet Matthew K and Lich Lisa M
Current Estimated Value
Home Financials for this Owner
Home Financials are based on the most recent Mortgage that was taken out on this home.
Original Mortgage
$177,955
Outstanding Balance
$126,123
Interest Rate
3.56%
Mortgage Type
New Conventional
Estimated Equity
$255,813
Purchase Details
Closed on
Nov 8, 2005
Sold by
Lindenbusch Carwin and Lindenbusch Susan C
Bought by
Lindenbusch Carwin B and Lindenbusch Susan C
Purchase Details
Closed on
Sep 23, 2004
Sold by
Mantia Gerald A and Mantia Carol R
Bought by
Lindenbusch Carwin and Lindenbusch Susan C
Home Financials for this Owner
Home Financials are based on the most recent Mortgage that was taken out on this home.
Original Mortgage
$205,200
Interest Rate
5.8%
Mortgage Type
Purchase Money Mortgage
Create a Home Valuation Report for This Property
The Home Valuation Report is an in-depth analysis detailing your home's value as well as a comparison with similar homes in the area
Home Values in the Area
Average Home Value in this Area
Purchase History
| Date | Buyer | Sale Price | Title Company |
|---|---|---|---|
| Bosslet Matthew K | $185,000 | Investors Title Co Clayton | |
| Lindenbusch Carwin B | -- | -- | |
| Lindenbusch Carwin | $216,000 | Freedom Title |
Source: Public Records
Mortgage History
| Date | Status | Borrower | Loan Amount |
|---|---|---|---|
| Open | Bosslet Matthew K | $177,955 | |
| Previous Owner | Lindenbusch Carwin | $205,200 |
Source: Public Records
Tax History
| Year | Tax Paid | Tax Assessment Tax Assessment Total Assessment is a certain percentage of the fair market value that is determined by local assessors to be the total taxable value of land and additions on the property. | Land | Improvement |
|---|---|---|---|---|
| 2025 | $3,937 | $71,000 | $15,160 | $55,840 |
| 2024 | $3,937 | $58,630 | $11,780 | $46,850 |
| 2023 | $3,887 | $58,630 | $11,780 | $46,850 |
| 2022 | $3,371 | $51,070 | $11,780 | $39,290 |
| 2021 | $3,262 | $51,070 | $11,780 | $39,290 |
| 2020 | $3,090 | $45,980 | $9,250 | $36,730 |
| 2019 | $3,080 | $45,980 | $9,250 | $36,730 |
| 2018 | $2,961 | $39,890 | $8,440 | $31,450 |
| 2017 | $2,956 | $39,890 | $8,440 | $31,450 |
| 2016 | $3,071 | $39,770 | $8,440 | $31,330 |
Source: Public Records
Map
Nearby Homes
- 4525 Eli Dr Unit F
- 4525 Eli Dr Unit D
- 4501 Eli Dr Unit K
- 4501 Eli Dr Unit I
- 4304 Southridge Meadows Ct
- 4515 von Talge Meadows Ct
- 42 Kassebaum Ln Unit 208
- 4596 Little Rock Rd
- 39 Kassebaum Ln Unit 101
- 37 Kassebaum Ln Unit 203
- 37 Kassebaum Ln Unit 207
- 4523 Little Rock Rd Unit D
- 35 Kassebaum Ln Unit 204
- 3558 Pearson Pointe Ct
- 4930 Mount Royal Rd
- 27 Kassebaum Ln Unit 202
- 3528 Summit Ave
- 4829 Gatesbury Dr
- 4839 Hursley Dr
- 4767 Towne South Rd
- 4485 Sunhill Dr
- 4473 Sunhill Dr
- 4500 Skyridge Dr
- 4506 Skyridge Dr
- 4505 Sunhill Dr
- 4474 Sunhill Dr
- 4467 Sunhill Dr
- 4512 Skyridge Dr
- 4470 Skyridge Dr
- 4511 Sunhill Dr
- 4468 Sunhill Dr
- 4518 Skyridge Dr
- 4461 Sunhill Dr
- 4464 Skyridge Dr
- 4494 Sunhill Dr
- 4482 Sunhill Dr
- 4517 Sunhill Dr
- 4504 Sunhill Dr
- 4462 Sunhill Dr
- 4471 Skyridge Dr
Your Personal Tour Guide
Ask me questions while you tour the home.