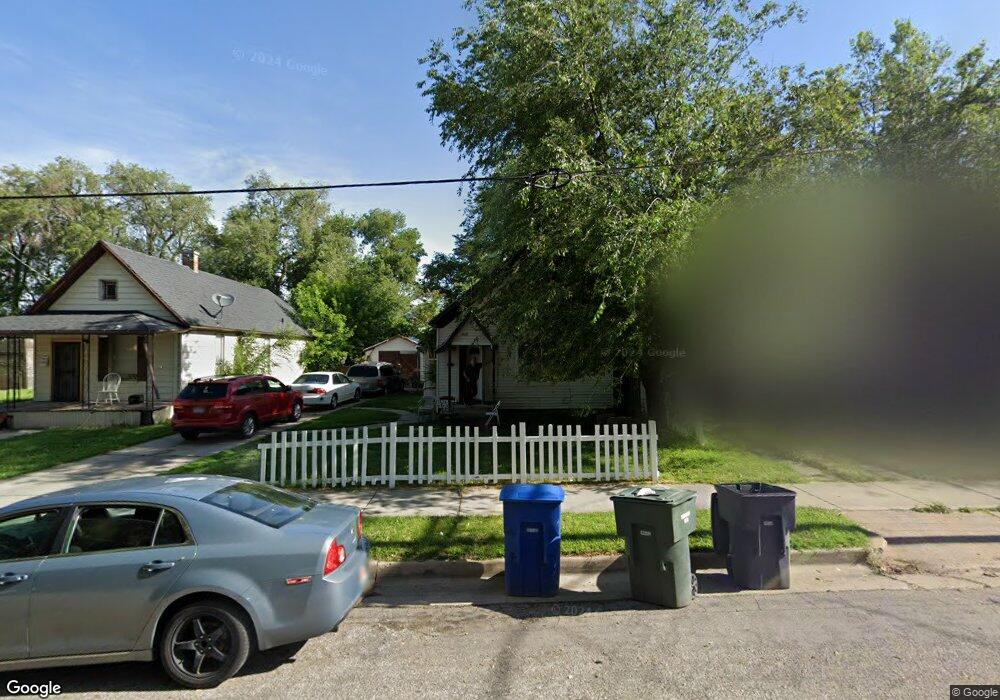
448 13th St Ogden, UT 84404
Canyon Road NeighborhoodEstimated Value: $256,000 - $290,000
2
Beds
1
Bath
748
Sq Ft
$368/Sq Ft
Est. Value
About This Home
This home is located at 448 13th St, Ogden, UT 84404 and is currently estimated at $275,246, approximately $367 per square foot. 448 13th St is a home located in Weber County with nearby schools including New Bridge School, Mound Fort Junior High School, and Ben Lomond High School.
Ownership History
Date
Name
Owned For
Owner Type
Purchase Details
Closed on
Apr 25, 2006
Sold by
Federal National Mortgage Association
Bought by
Romero Adrian
Current Estimated Value
Home Financials for this Owner
Home Financials are based on the most recent Mortgage that was taken out on this home.
Original Mortgage
$54,900
Outstanding Balance
$37,000
Interest Rate
9.57%
Mortgage Type
Fannie Mae Freddie Mac
Estimated Equity
$238,246
Purchase Details
Closed on
Jan 5, 2006
Sold by
Mita Jose and Jp Morgan Chase Bank Na
Bought by
Federal National Mortgage Association
Purchase Details
Closed on
May 24, 2005
Sold by
Mita Jose
Bought by
Zapata Nidia
Purchase Details
Closed on
Dec 30, 2004
Sold by
Arrambide Debora
Bought by
Burns Pat
Purchase Details
Closed on
Jan 5, 2004
Sold by
Burns Pat
Bought by
Sipes William
Purchase Details
Closed on
Nov 28, 2003
Sold by
Duncan Ora Lee
Bought by
Duncan Ora Lee and Duncan James Horace
Create a Home Valuation Report for This Property
The Home Valuation Report is an in-depth analysis detailing your home's value as well as a comparison with similar homes in the area
Home Values in the Area
Average Home Value in this Area
Purchase History
| Date | Buyer | Sale Price | Title Company |
|---|---|---|---|
| Romero Adrian | $54,900 | Us Title Of Utah Ogden | |
| Federal National Mortgage Association | $76,706 | None Available | |
| Zapata Nidia | -- | -- | |
| Burns Pat | -- | -- | |
| Arrambide Debora | -- | Backman Stewart Title | |
| Sipes William | -- | -- | |
| Duncan Ora Lee | -- | -- |
Source: Public Records
Mortgage History
| Date | Status | Borrower | Loan Amount |
|---|---|---|---|
| Open | Romero Adrian | $54,900 |
Source: Public Records
Tax History
| Year | Tax Paid | Tax Assessment Tax Assessment Total Assessment is a certain percentage of the fair market value that is determined by local assessors to be the total taxable value of land and additions on the property. | Land | Improvement |
|---|---|---|---|---|
| 2025 | $1,752 | $256,837 | $96,393 | $160,444 |
| 2024 | $1,716 | $135,848 | $53,030 | $82,818 |
| 2023 | $1,560 | $124,299 | $50,959 | $73,340 |
| 2022 | $1,618 | $129,249 | $45,577 | $83,672 |
| 2021 | $1,335 | $177,000 | $43,101 | $133,899 |
| 2020 | $1,127 | $138,000 | $33,472 | $104,528 |
| 2019 | $1,104 | $127,000 | $30,359 | $96,641 |
| 2018 | $884 | $101,000 | $30,359 | $70,641 |
| 2017 | $824 | $88,002 | $24,840 | $63,162 |
| 2016 | $659 | $38,045 | $13,826 | $24,219 |
| 2015 | $547 | $30,795 | $13,826 | $16,969 |
| 2014 | $553 | $30,598 | $11,106 | $19,492 |
Source: Public Records
Map
Nearby Homes
- 506 14th St
- 360 13th St
- 443 E 1415 S Unit 118
- 439 E 1415 S Unit 117
- 433 E 1415 S Unit 116
- 425 E 1415 S Unit 114
- 344 13th St
- 1442 S 410 E Unit 134
- 1446 S 410 E Unit 135
- 486 15th St
- 1413 S Jefferson Ave
- 1504 Washington Blvd
- 1107 Jefferson Ave
- 284 14th St
- 1424 Jefferson Ave
- 1110 Jefferson Ave
- 235 13th St
- 1529 Jefferson Ave
- 968 S Jefferson Ave
- 425 Canyon Rd
Your Personal Tour Guide
Ask me questions while you tour the home.