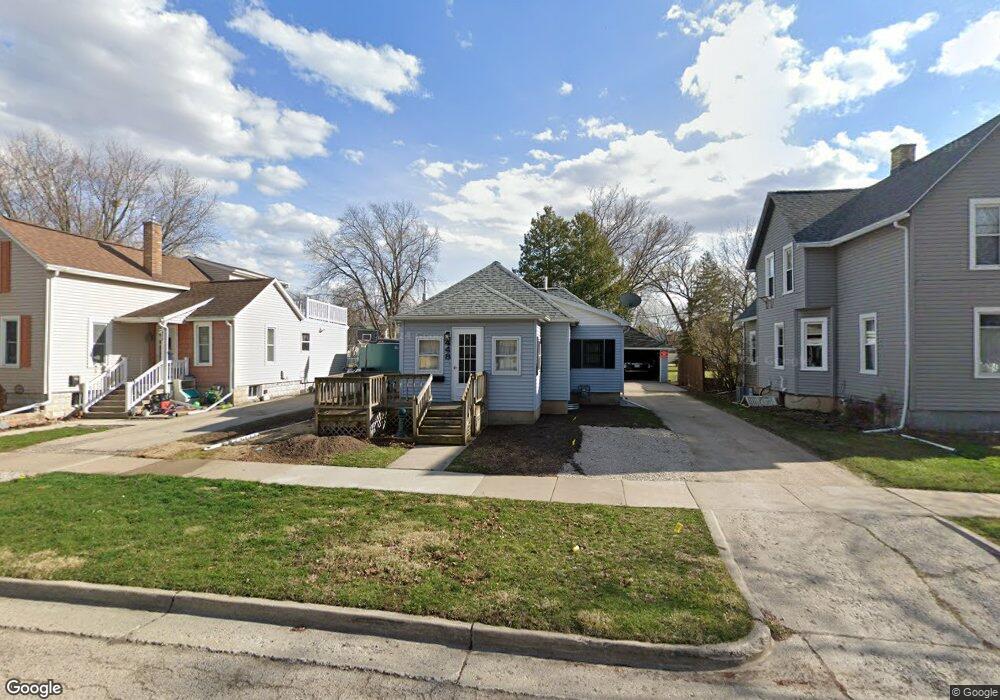
448 3rd St Fond Du Lac, WI 54935
Estimated Value: $181,000 - $192,519
3
Beds
2
Baths
1,074
Sq Ft
$174/Sq Ft
Est. Value
About This Home
This home is located at 448 3rd St, Fond Du Lac, WI 54935 and is currently estimated at $187,130, approximately $174 per square foot. 448 3rd St is a home located in Fond du Lac County with nearby schools including Roberts Elementary School, Woodworth Middle School, and Fond du Lac High School.
Ownership History
Date
Name
Owned For
Owner Type
Purchase Details
Closed on
Jan 18, 2008
Sold by
Nagel Property Investments Llc
Bought by
Hass Andrew D
Current Estimated Value
Home Financials for this Owner
Home Financials are based on the most recent Mortgage that was taken out on this home.
Original Mortgage
$94,122
Outstanding Balance
$59,443
Interest Rate
6.17%
Mortgage Type
FHA
Estimated Equity
$127,687
Purchase Details
Closed on
Sep 27, 2007
Sold by
Citicorp Trust Bank Fsb
Bought by
Properties Investments Llc
Purchase Details
Closed on
Jul 13, 2007
Sold by
Donnelly Jeffery G and Donnelly Amy R
Bought by
Citicorp Trust Bank Fsb
Create a Home Valuation Report for This Property
The Home Valuation Report is an in-depth analysis detailing your home's value as well as a comparison with similar homes in the area
Home Values in the Area
Average Home Value in this Area
Purchase History
| Date | Buyer | Sale Price | Title Company |
|---|---|---|---|
| Hass Andrew D | $95,600 | None Available | |
| Properties Investments Llc | $66,000 | None Available | |
| Citicorp Trust Bank Fsb | $87,900 | None Available |
Source: Public Records
Mortgage History
| Date | Status | Borrower | Loan Amount |
|---|---|---|---|
| Open | Hass Andrew D | $94,122 |
Source: Public Records
Tax History Compared to Growth
Tax History
| Year | Tax Paid | Tax Assessment Tax Assessment Total Assessment is a certain percentage of the fair market value that is determined by local assessors to be the total taxable value of land and additions on the property. | Land | Improvement |
|---|---|---|---|---|
| 2024 | $2,312 | $98,500 | $17,000 | $81,500 |
| 2023 | $2,219 | $98,500 | $17,000 | $81,500 |
| 2022 | $2,115 | $98,500 | $17,000 | $81,500 |
| 2021 | $2,104 | $98,500 | $17,000 | $81,500 |
| 2020 | $2,147 | $98,500 | $17,000 | $81,500 |
| 2019 | $2,120 | $98,500 | $17,000 | $81,500 |
| 2018 | $2,012 | $87,200 | $17,000 | $70,200 |
| 2017 | $2,019 | $87,200 | $17,000 | $70,200 |
| 2016 | $2,013 | $87,200 | $17,000 | $70,200 |
| 2015 | $2,043 | $87,200 | $17,000 | $70,200 |
| 2014 | -- | $87,200 | $17,000 | $70,200 |
| 2013 | $2,095 | $91,300 | $18,900 | $72,400 |
Source: Public Records
Map
Nearby Homes