Estimated Value: $286,000 - $324,000
3
Beds
2
Baths
1,620
Sq Ft
$193/Sq Ft
Est. Value
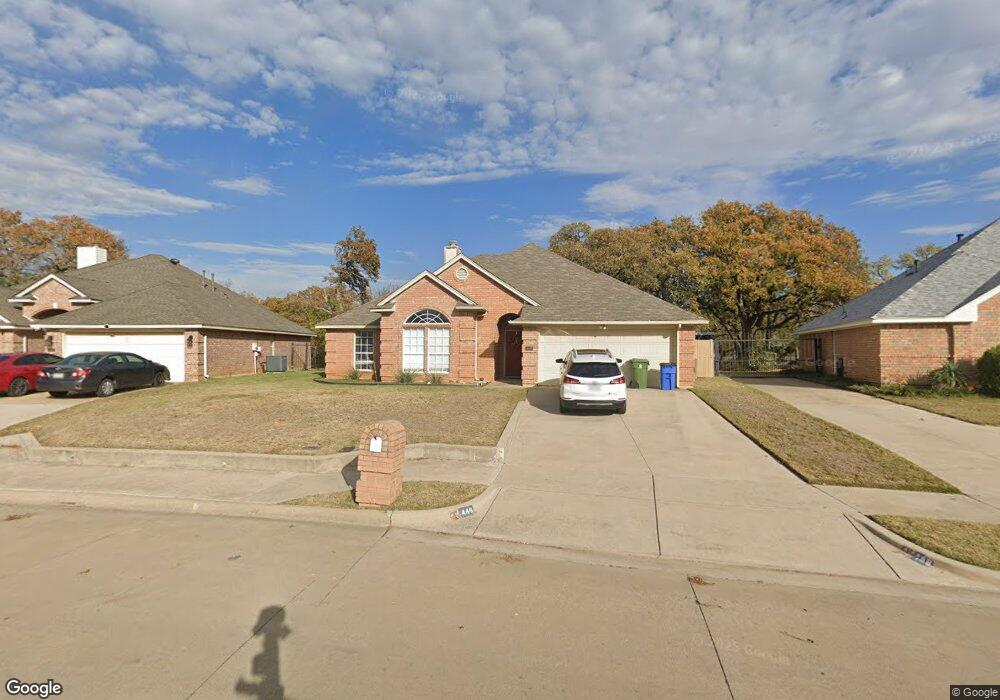
About This Home
This home is located at 448 Arwine Dr, Hurst, TX 76053 and is currently estimated at $313,012, approximately $193 per square foot. 448 Arwine Dr is a home located in Tarrant County with nearby schools including Bellaire Elementary School, Hurst J High School, and L.D. Bell High School.
Ownership History
Date
Name
Owned For
Owner Type
Purchase Details
Closed on
Jan 28, 2004
Sold by
Spears Steven Kirk and Spears Jessica Lynn
Bought by
Childs Kyla C
Current Estimated Value
Home Financials for this Owner
Home Financials are based on the most recent Mortgage that was taken out on this home.
Original Mortgage
$102,800
Outstanding Balance
$48,045
Interest Rate
5.78%
Mortgage Type
Purchase Money Mortgage
Estimated Equity
$264,967
Purchase Details
Closed on
May 4, 1994
Sold by
Rml Inc
Bought by
Spears Steven Kirk and Spears Jessica Lynn
Home Financials for this Owner
Home Financials are based on the most recent Mortgage that was taken out on this home.
Original Mortgage
$70,000
Interest Rate
8.03%
Purchase Details
Closed on
Oct 8, 1993
Sold by
Builta Kenneth
Bought by
R M L Inc
Home Financials for this Owner
Home Financials are based on the most recent Mortgage that was taken out on this home.
Original Mortgage
$76,800
Interest Rate
6.87%
Create a Home Valuation Report for This Property
The Home Valuation Report is an in-depth analysis detailing your home's value as well as a comparison with similar homes in the area
Home Values in the Area
Average Home Value in this Area
Purchase History
| Date | Buyer | Sale Price | Title Company |
|---|---|---|---|
| Childs Kyla C | -- | American Title Co | |
| Spears Steven Kirk | -- | First American Title Co | |
| R M L Inc | -- | First American Title Co |
Source: Public Records
Mortgage History
| Date | Status | Borrower | Loan Amount |
|---|---|---|---|
| Open | Childs Kyla C | $102,800 | |
| Previous Owner | Spears Steven Kirk | $70,000 | |
| Previous Owner | R M L Inc | $76,800 | |
| Closed | Childs Kyla C | $25,700 |
Source: Public Records
Tax History
| Year | Tax Paid | Tax Assessment Tax Assessment Total Assessment is a certain percentage of the fair market value that is determined by local assessors to be the total taxable value of land and additions on the property. | Land | Improvement |
|---|---|---|---|---|
| 2025 | $5,750 | $281,510 | $50,000 | $231,510 |
| 2024 | $5,750 | $281,510 | $50,000 | $231,510 |
| 2023 | $5,154 | $257,241 | $35,000 | $222,241 |
| 2022 | $5,842 | $253,741 | $35,000 | $218,741 |
| 2021 | $5,871 | $243,431 | $35,000 | $208,431 |
| 2020 | $5,191 | $215,755 | $35,000 | $180,755 |
| 2019 | $5,302 | $216,647 | $35,000 | $181,647 |
| 2018 | $4,616 | $188,607 | $15,000 | $173,607 |
| 2017 | $4,160 | $164,400 | $15,000 | $149,400 |
| 2016 | $4,900 | $193,632 | $15,000 | $178,632 |
| 2015 | $3,732 | $142,300 | $15,000 | $127,300 |
| 2014 | $3,732 | $142,300 | $15,000 | $127,300 |
Source: Public Records
Map
Nearby Homes
- 4106 Hollow Oak Dr
- 1302 Woodridge Cir
- 1309 Driftwood Dr
- 840 Forest Hollow Dr
- 413 Wanda Way
- 212 E Ellen Ave
- 308 Wanda Way
- 832 Chateau Valee Cir
- 808 Lee Dr
- 312 E Ellen Ave
- 803 Glenda Dr
- 802 Brown Trail
- 260 Corinna Ct
- 10401 Lake Park Dr
- 904 Nelson Terrace
- 933 Wade Dr
- 108 Donald Dr
- 909 Overhill Dr
- 552 Norwood Dr
- 205 Corinna Ct
- 452 Arwine Dr
- 444 Arwine Dr
- 456 Arwine Dr
- 440 Arwine Dr
- 1502 Woodridge Cir
- 1500 Woodridge Cir
- 1504 Woodridge Cir
- 460 Arwine Dr
- 436 Arwine Dr
- 437 Arwine Dr
- 1408 Woodridge Cir
- 409 Woodland Ct
- 464 Arwine Dr
- 745 Brookfield Dr
- 433 Arwine Dr
- 405 Woodland Ct
- 432 Arwine Dr
- 429 Arwine Dr
- 748 Brookfield Dr
- 741 Brookfield Dr
Your Personal Tour Guide
Ask me questions while you tour the home.