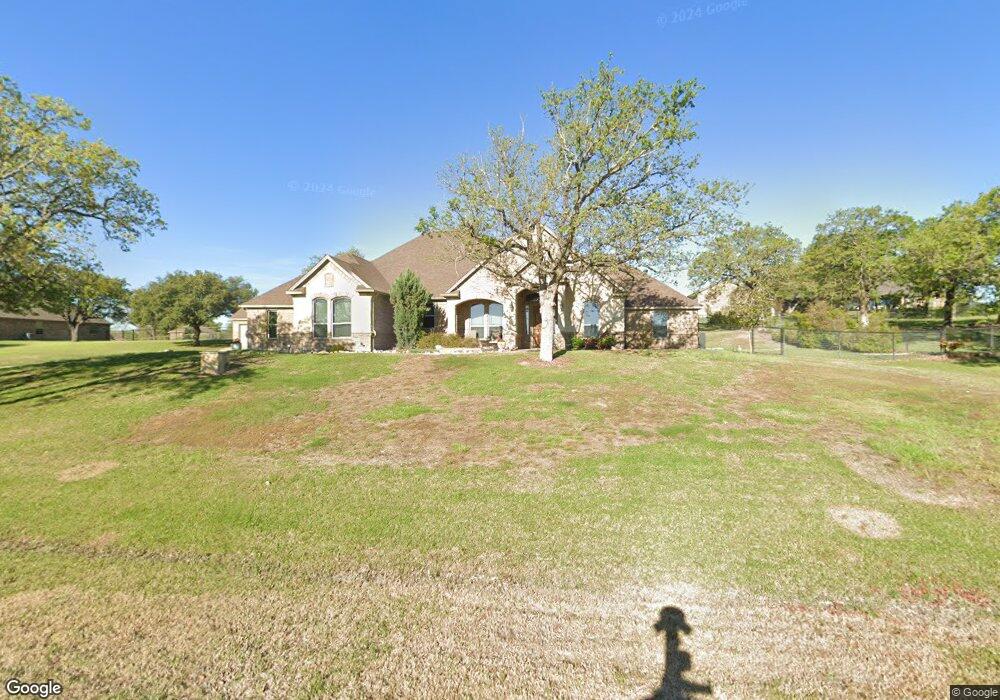
448 Ellis Creek Ln Weatherford, TX 76085
Estimated Value: $560,143 - $591,000
4
Beds
2
Baths
2,333
Sq Ft
$247/Sq Ft
Est. Value
About This Home
This home is located at 448 Ellis Creek Ln, Weatherford, TX 76085 and is currently estimated at $577,036, approximately $247 per square foot. 448 Ellis Creek Ln is a home located in Parker County with nearby schools including Crockett Elementary School, Tison Middle School, and Weatherford High School.
Ownership History
Date
Name
Owned For
Owner Type
Purchase Details
Closed on
Jul 7, 2015
Sold by
Flores Austin L and Flores Jennifer L
Bought by
Head Terry and Head Shelley
Current Estimated Value
Purchase Details
Closed on
Jul 24, 2013
Sold by
Ray French Land Company Ltd
Bought by
Head Terry and Head Shelley
Home Financials for this Owner
Home Financials are based on the most recent Mortgage that was taken out on this home.
Original Mortgage
$254,100
Interest Rate
3.99%
Mortgage Type
New Conventional
Purchase Details
Closed on
May 18, 2010
Sold by
First National Bank Of W Ford
Bought by
Head Terry and Head Shelley
Purchase Details
Closed on
Jan 7, 2010
Sold by
Ellis Parker Creek Lp
Bought by
Head Terry and Head Shelley
Purchase Details
Closed on
Dec 28, 2007
Sold by
Ellis Parker Creek Lp
Bought by
Head Terry and Head Shelley
Create a Home Valuation Report for This Property
The Home Valuation Report is an in-depth analysis detailing your home's value as well as a comparison with similar homes in the area
Home Values in the Area
Average Home Value in this Area
Purchase History
| Date | Buyer | Sale Price | Title Company |
|---|---|---|---|
| Head Terry | -- | Providence Title Company | |
| Head Terry | -- | -- | |
| Flores Austin L | -- | Providence Title | |
| Head Terry | -- | -- | |
| Head Terry | -- | -- | |
| Head Terry | -- | -- |
Source: Public Records
Mortgage History
| Date | Status | Borrower | Loan Amount |
|---|---|---|---|
| Previous Owner | Flores Austin L | $254,100 |
Source: Public Records
Tax History Compared to Growth
Tax History
| Year | Tax Paid | Tax Assessment Tax Assessment Total Assessment is a certain percentage of the fair market value that is determined by local assessors to be the total taxable value of land and additions on the property. | Land | Improvement |
|---|---|---|---|---|
| 2025 | $4,342 | $503,082 | -- | -- |
| 2024 | $4,342 | $457,347 | -- | -- |
| 2023 | $4,342 | $415,770 | $0 | $0 |
| 2022 | $7,037 | $377,980 | $40,000 | $337,980 |
| 2021 | $7,630 | $377,980 | $40,000 | $337,980 |
| 2020 | $7,306 | $360,190 | $40,000 | $320,190 |
| 2019 | $7,606 | $360,190 | $40,000 | $320,190 |
| 2018 | $6,951 | $319,540 | $40,000 | $279,540 |
| 2017 | $7,093 | $319,540 | $40,000 | $279,540 |
| 2016 | $6,729 | $303,170 | $40,000 | $263,170 |
| 2015 | $5,867 | $277,080 | $40,000 | $237,080 |
| 2014 | $4,891 | $241,550 | $40,000 | $201,550 |
Source: Public Records
Map
Nearby Homes
- 209 Ellis Creek Dr
- 600 Joyce St
- 150 Ellis Spring Dr
- 2277 Tanglewood St
- 2358 Tanglewood St
- 1712 Madison St
- 305-B E 8th St
- 305 E 8th St
- 1211 Van Winkle St
- 221 E 7th St
- 1835 N Main St
- 1829 N Main St
- 506 E 5th St
- 801 E 3rd St
- 505 E 4th St
- 201 E 7th St
- 1407 N Rusk St
- 203 E 7th St
- 817 E 2nd St
- 109 Odel Dr
- 478 Ellis Creek Ln
- 456 Ellis Creek Ln
- 442 Ellis Creek Ln
- 107 Ellis Pond Ct
- 443 Ellis Creek Ln
- 113 Ellis Pond Ct
- 101 Ellis Pond Ct
- 455 Ellis Creek Ln
- 437 Ellis Creek Ln
- 119 Ellis Pond Ct
- 467 Ellis Creek Ln
- 425 Ellis Creek Ln
- 103 Field Creek Ct
- 106 Ellis Pond Ct
- 112 Ellis Pond Ct
- 419 Ellis Creek Ln
- 118 Ellis Pond Ct
- 413 Ellis Creek Dr
- 106 Field Creek Ct
- 197 Ellis Creek Dr