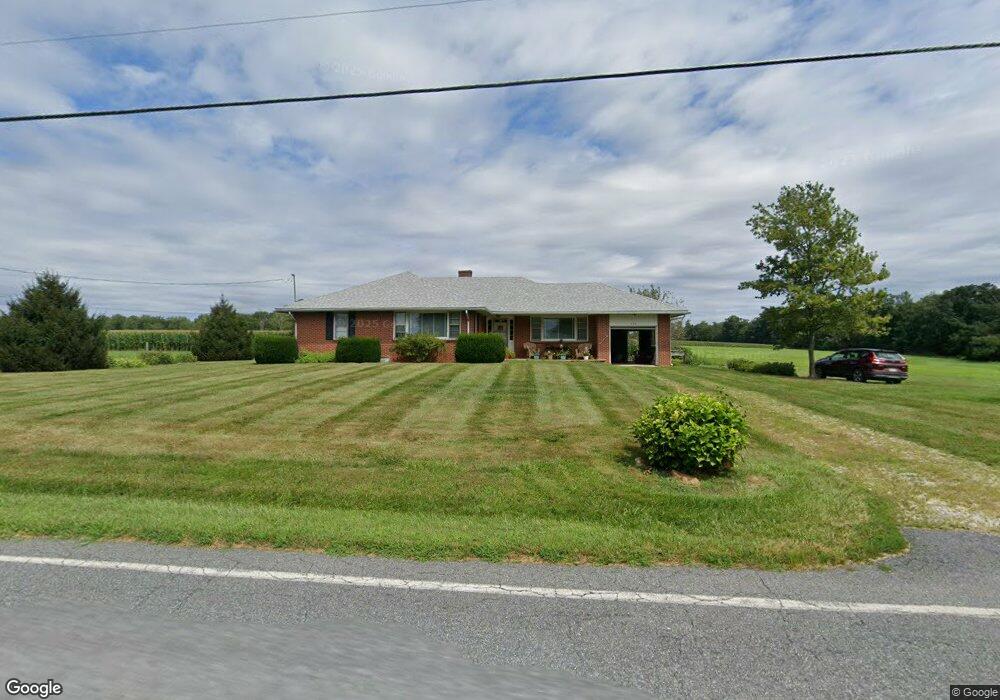
448 England Creamery Rd North East, MD 21901
Estimated Value: $292,840 - $354,000
--
Bed
1
Bath
1,800
Sq Ft
$183/Sq Ft
Est. Value
About This Home
This home is located at 448 England Creamery Rd, North East, MD 21901 and is currently estimated at $329,960, approximately $183 per square foot. 448 England Creamery Rd is a home located in Cecil County with nearby schools including Calvert Elementary School, Rising Sun Middle School, and Rising Sun High School.
Ownership History
Date
Name
Owned For
Owner Type
Purchase Details
Closed on
Oct 23, 2025
Sold by
England Thomas Howard and England Jeffrey D
Bought by
England Thomas Howard and England Jeffrey D
Current Estimated Value
Purchase Details
Closed on
Apr 9, 2025
Sold by
England Doris D
Bought by
England Thomas Howard and England Jeffrey D
Purchase Details
Closed on
May 10, 2024
Sold by
England Thomas Howard
Bought by
England Thomas Howard and England Thomas Howard
Purchase Details
Closed on
Jul 25, 2023
Sold by
England Thomas Howard
Bought by
England Thomas Howard and England Jeffrey D
Purchase Details
Closed on
Aug 31, 2022
Sold by
Hill Raymond G
Bought by
Hill Raymond G
Purchase Details
Closed on
Nov 5, 2014
Sold by
England Thomas Howard and Estate Of Doris D England
Bought by
Wilson Leonard E and England Doris D
Create a Home Valuation Report for This Property
The Home Valuation Report is an in-depth analysis detailing your home's value as well as a comparison with similar homes in the area
Home Values in the Area
Average Home Value in this Area
Purchase History
| Date | Buyer | Sale Price | Title Company |
|---|---|---|---|
| England Thomas Howard | -- | None Listed On Document | |
| England Thomas Howard | -- | Ardent Title | |
| England Thomas Howard | -- | Ardent Title | |
| England Thomas Howard | -- | None Listed On Document | |
| England Thomas Howard | -- | None Listed On Document | |
| England Thomas Howard | -- | None Listed On Document | |
| Hill Raymond G | -- | None Listed On Document | |
| Wilson Leonard E | -- | None Available |
Source: Public Records
Tax History Compared to Growth
Tax History
| Year | Tax Paid | Tax Assessment Tax Assessment Total Assessment is a certain percentage of the fair market value that is determined by local assessors to be the total taxable value of land and additions on the property. | Land | Improvement |
|---|---|---|---|---|
| 2025 | $2,624 | $248,100 | $74,300 | $173,800 |
| 2024 | $2,171 | $234,367 | $0 | $0 |
| 2023 | $1,743 | $220,633 | $0 | $0 |
| 2022 | $2,390 | $206,900 | $74,300 | $132,600 |
| 2021 | $2,342 | $203,967 | $0 | $0 |
| 2020 | $2,379 | $201,033 | $0 | $0 |
| 2019 | $2,345 | $198,100 | $74,300 | $123,800 |
| 2018 | $2,303 | $194,500 | $0 | $0 |
| 2017 | $2,262 | $190,900 | $0 | $0 |
| 2016 | $2,119 | $187,300 | $0 | $0 |
| 2015 | $2,119 | $186,700 | $0 | $0 |
| 2014 | $1,947 | $186,100 | $0 | $0 |
Source: Public Records
Map
Nearby Homes
- 521 England Creamery Rd Unit 3 PARCEL
- 521 England Creamery Rd Unit 2 PARCEL
- 521 England Creamery Rd Unit 1 PARCEL
- 310 Old Zion Rd
- 17 Frank Crane Dr
- 1072 Calvert Rd
- 50 Hudler Ln
- 226 Old Farmington Rd
- 91 Bard Cameron Rd
- 0 Old Bayview Rd
- 29 Stony Chase Dr
- 23 Stony Chase Dr
- 28 Stony Chase Dr Unit 28
- 53 Buckwheat Run Rd
- 18 Madison Paige Dr
- 42 Madison Paige Dr
- Topaz Plan at Montgomery Oaks
- Frankford Plan at Montgomery Oaks
- Hamilton Plan at Montgomery Oaks
- Pearl Plan at Montgomery Oaks
- 455 England Creamery Rd
- 543 Kirks Mill Ln
- 373 England Creamery Rd
- 483 England Creamery Rd
- 352 England Creamery Rd
- 521 England Creamery Rd
- 328 England Creamery Rd
- 56 Branch Rd
- 37 Zion Acres Rd
- 59 Zion Acres Rd
- 71 Branch Rd
- 69 Zion Acres Rd
- 310 England Creamery Rd
- 27 Zion Acres Rd
- 77 Zion Acres Rd
- 38 Zion Acres Rd
- 309 England Creamery Rd
- 26 Zion Acres Rd
- 58 Zion Acres Rd
- 18 Porter Rd