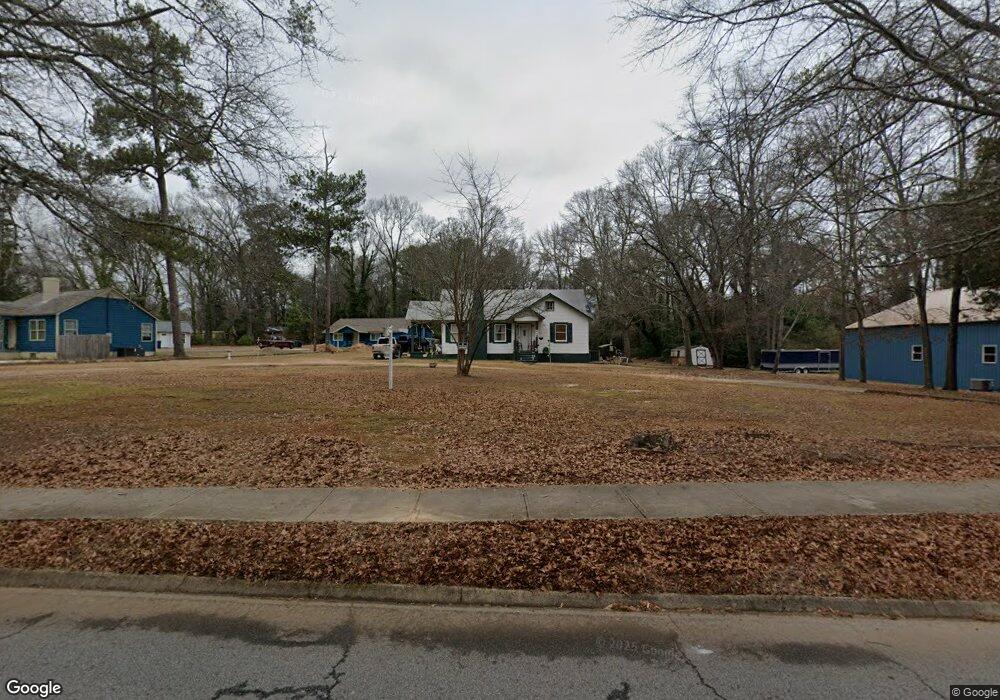
448 Hammond Dr Griffin, GA 30224
Spalding County NeighborhoodEstimated Value: $115,758 - $166,000
2
Beds
1
Bath
988
Sq Ft
$145/Sq Ft
Est. Value
About This Home
This home is located at 448 Hammond Dr, Griffin, GA 30224 and is currently estimated at $143,690, approximately $145 per square foot. 448 Hammond Dr is a home located in Spalding County with nearby schools including Anne Street Elementary School, Rehoboth Road Middle School, and Griffin High School.
Ownership History
Date
Name
Owned For
Owner Type
Purchase Details
Closed on
Jun 2, 2016
Sold by
Bradley Margie D
Bought by
Arnold Steve
Current Estimated Value
Purchase Details
Closed on
Nov 8, 2002
Sold by
Taylor Virginia F
Bought by
Bradley Margie D
Purchase Details
Closed on
Jun 28, 1977
Sold by
Newby Robert L
Bought by
Taylor William H
Purchase Details
Closed on
Sep 28, 1962
Bought by
Newby Robert L
Create a Home Valuation Report for This Property
The Home Valuation Report is an in-depth analysis detailing your home's value as well as a comparison with similar homes in the area
Home Values in the Area
Average Home Value in this Area
Purchase History
| Date | Buyer | Sale Price | Title Company |
|---|---|---|---|
| Arnold Steve | $16,000 | -- | |
| Bradley Margie D | -- | -- | |
| Taylor William H | $36,000 | -- | |
| Newby Robert L | -- | -- |
Source: Public Records
Tax History Compared to Growth
Tax History
| Year | Tax Paid | Tax Assessment Tax Assessment Total Assessment is a certain percentage of the fair market value that is determined by local assessors to be the total taxable value of land and additions on the property. | Land | Improvement |
|---|---|---|---|---|
| 2024 | $1,141 | $29,881 | $10,240 | $19,641 |
| 2023 | $1,141 | $24,282 | $5,120 | $19,162 |
| 2022 | $810 | $20,274 | $3,200 | $17,074 |
| 2021 | $753 | $18,839 | $3,200 | $15,639 |
| 2020 | $645 | $16,138 | $3,498 | $12,640 |
| 2019 | $657 | $16,138 | $3,498 | $12,640 |
| 2018 | $632 | $14,966 | $3,498 | $11,468 |
| 2017 | $212 | $14,966 | $3,498 | $11,468 |
| 2016 | $163 | $14,966 | $3,498 | $11,468 |
| 2015 | $166 | $14,966 | $3,498 | $11,468 |
| 2014 | $172 | $14,966 | $3,498 | $11,468 |
Source: Public Records
Map
Nearby Homes
- 1228-1328 Edgewood Ave
- 1313 D F Fuller Dr
- 1326 Oakdale Dr
- 1264 Cherokee Ave
- 309 Cherokee Cir
- 1022 Beck St
- 1054 W College Street Extension
- 305 S 18th St
- 820 Pamela Dr
- 825 Pamela Dr
- 1012 W College Extension
- 717 Scales St
- 731 Scales St
- 141 North Expy
- 450 Carver
- 754 Scales St
- 915 W Poplar St
- 811 Westbrook St
- 854 Scales St
- 203 Hillside Cir
- 454 Hammond Dr
- 456 Hammond Dr
- 438 Hammond Dr
- 438 Hammond Dr
- 438 Hammond Dr Unit B
- 430 Hammond Dr
- 428 Hammond Dr
- 462 Hammond Dr
- 449 Hammond Dr
- 451 Hammond Dr
- 439 Hammond Dr
- 453 Hammond Dr
- 424 Hammond Dr
- 455 Hammond Dr
- 443 Hammond Dr
- 437 Hammond Dr
- 464 Hammond Dr
- 457 Hammond Dr
- 0 Edgewood Ave Unit 7270140
- 0 Edgewood Ave Unit 8505250