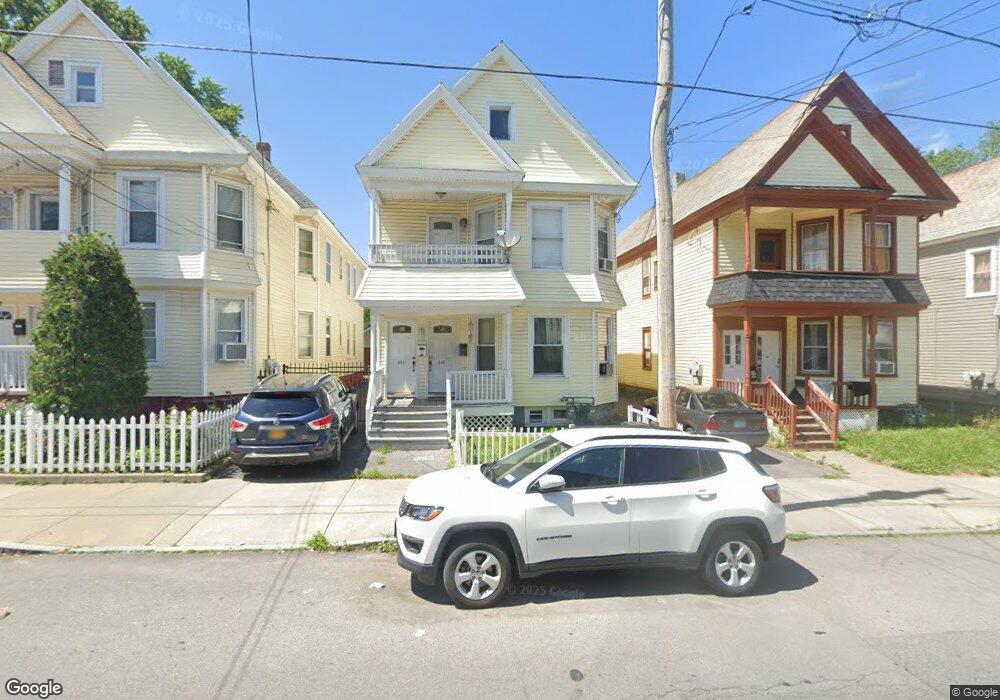
448 Hulett St Schenectady, NY 12307
Hamilton Hill NeighborhoodEstimated Value: $168,610 - $274,000
6
Beds
2
Baths
2,512
Sq Ft
$85/Sq Ft
Est. Value
About This Home
This home is located at 448 Hulett St, Schenectady, NY 12307 and is currently estimated at $212,653, approximately $84 per square foot. 448 Hulett St is a home located in Schenectady County with nearby schools including Pleasant Valley School, Mont Pleasant Middle School, and Schenectady High School.
Ownership History
Date
Name
Owned For
Owner Type
Purchase Details
Closed on
Nov 28, 2006
Current Estimated Value
Home Financials for this Owner
Home Financials are based on the most recent Mortgage that was taken out on this home.
Original Mortgage
$45,000
Outstanding Balance
$26,979
Interest Rate
6.36%
Mortgage Type
Purchase Money Mortgage
Estimated Equity
$185,674
Purchase Details
Closed on
Apr 30, 2001
Sold by
Secretary Of Housing & Urban Dev
Bought by
Nandial Changoon
Purchase Details
Closed on
Sep 22, 2000
Purchase Details
Closed on
Aug 4, 1998
Sold by
Jones David
Bought by
Romand James P
Create a Home Valuation Report for This Property
The Home Valuation Report is an in-depth analysis detailing your home's value as well as a comparison with similar homes in the area
Home Values in the Area
Average Home Value in this Area
Purchase History
| Date | Buyer | Sale Price | Title Company |
|---|---|---|---|
| -- | $45,000 | -- | |
| Nandial Changoon | $6,125 | Timothy J Elliott | |
| -- | -- | -- | |
| Romand James P | $23,800 | -- |
Source: Public Records
Mortgage History
| Date | Status | Borrower | Loan Amount |
|---|---|---|---|
| Open | -- | $45,000 |
Source: Public Records
Tax History
| Year | Tax Paid | Tax Assessment Tax Assessment Total Assessment is a certain percentage of the fair market value that is determined by local assessors to be the total taxable value of land and additions on the property. | Land | Improvement |
|---|---|---|---|---|
| 2024 | $4,602 | $69,300 | $10,400 | $58,900 |
| 2023 | $44 | $69,300 | $10,400 | $58,900 |
| 2022 | $4,280 | $69,300 | $10,400 | $58,900 |
| 2021 | $4,242 | $69,300 | $10,400 | $58,900 |
| 2020 | $4,159 | $69,300 | $10,400 | $58,900 |
| 2019 | $2,723 | $69,300 | $10,400 | $58,900 |
| 2018 | $3,472 | $69,300 | $10,400 | $58,900 |
| 2017 | $2,766 | $69,300 | $10,400 | $58,900 |
| 2016 | $3,579 | $69,300 | $10,400 | $58,900 |
| 2015 | -- | $69,300 | $10,400 | $58,900 |
| 2014 | -- | $69,300 | $10,400 | $58,900 |
Source: Public Records
Map
Nearby Homes
- 494 Hulett St
- 821 Strong St
- 750 Hamilton St
- 806 Strong St
- 740 Hamilton St
- 347 Hulett St
- 510 Mumford St
- 546 Paige St
- 515 Summit Ave
- 421 Summit Ave
- 420 Summit Ave
- 1013 Delamont Ave
- 320 Germania Ave
- 222 Duane Ave
- 889 Yorkston St
- 28 Steuben St
- 312 Georgetta Dix Plaza
- 817 Holland Rd
- 578 Crane St
- 1 Chestnut St
Your Personal Tour Guide
Ask me questions while you tour the home.