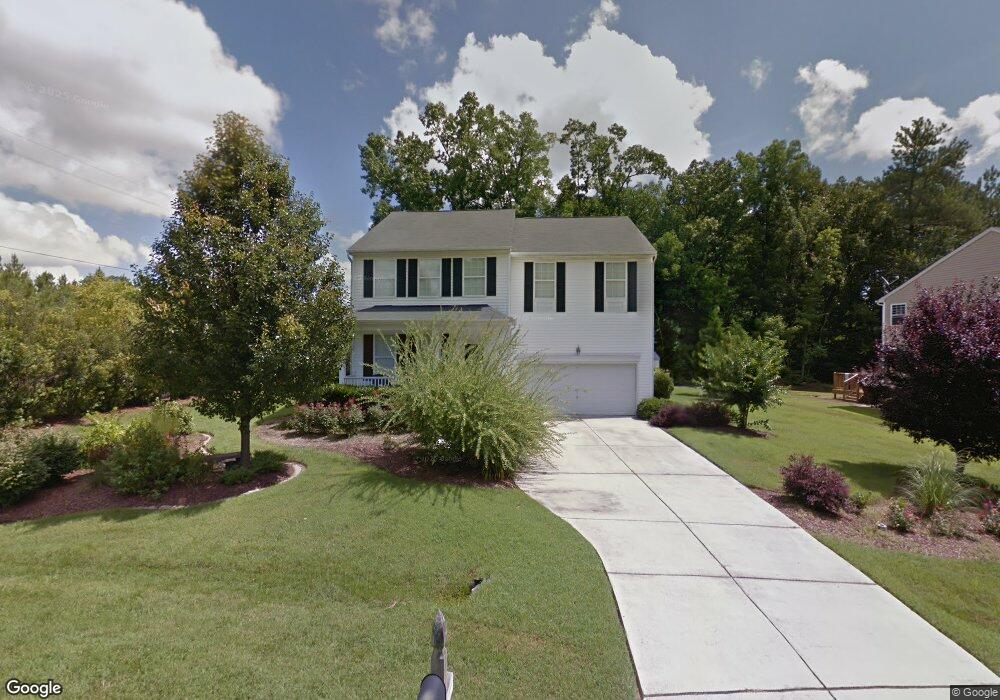
448 Mayview Dr Creedmoor, NC 27522
Estimated Value: $373,000 - $422,000
3
Beds
3
Baths
2,706
Sq Ft
$147/Sq Ft
Est. Value
About This Home
This home is located at 448 Mayview Dr, Creedmoor, NC 27522 and is currently estimated at $397,746, approximately $146 per square foot. 448 Mayview Dr is a home located in Granville County with nearby schools including Mount Energy Elementary School, G.C. Hawley Middle School, and South Granville High School.
Ownership History
Date
Name
Owned For
Owner Type
Purchase Details
Closed on
Jun 16, 2017
Sold by
Lyon Marcos and Lyon Staci
Bought by
Dickerson Kristin L and Dickerson Douglas R
Current Estimated Value
Home Financials for this Owner
Home Financials are based on the most recent Mortgage that was taken out on this home.
Original Mortgage
$217,979
Outstanding Balance
$180,664
Interest Rate
3.89%
Mortgage Type
FHA
Estimated Equity
$217,082
Purchase Details
Closed on
Jun 18, 2015
Sold by
Lyon Marcos and Lyon Staci
Bought by
Lyon Marcos and Lyon Staci
Home Financials for this Owner
Home Financials are based on the most recent Mortgage that was taken out on this home.
Original Mortgage
$177,430
Interest Rate
3.89%
Mortgage Type
FHA
Purchase Details
Closed on
Apr 17, 2003
Bought by
Lyon Marcus and Lyon Staci
Create a Home Valuation Report for This Property
The Home Valuation Report is an in-depth analysis detailing your home's value as well as a comparison with similar homes in the area
Home Values in the Area
Average Home Value in this Area
Purchase History
| Date | Buyer | Sale Price | Title Company |
|---|---|---|---|
| Dickerson Kristin L | $222,000 | None Available | |
| Lyon Marcos | -- | Lvg Title & Escrow Llc | |
| Lyon Marcus | $186,000 | -- |
Source: Public Records
Mortgage History
| Date | Status | Borrower | Loan Amount |
|---|---|---|---|
| Open | Dickerson Kristin L | $217,979 | |
| Previous Owner | Lyon Marcos | $177,430 |
Source: Public Records
Tax History
| Year | Tax Paid | Tax Assessment Tax Assessment Total Assessment is a certain percentage of the fair market value that is determined by local assessors to be the total taxable value of land and additions on the property. | Land | Improvement |
|---|---|---|---|---|
| 2025 | $4,649 | $389,279 | $45,000 | $344,279 |
| 2024 | $4,649 | $389,279 | $45,000 | $344,279 |
| 2023 | $4,263 | $221,127 | $22,500 | $198,627 |
| 2022 | $3,349 | $221,127 | $22,500 | $198,627 |
| 2021 | $3,344 | $221,127 | $22,500 | $198,627 |
| 2020 | $3,344 | $221,127 | $22,500 | $198,627 |
| 2019 | $3,344 | $221,127 | $22,500 | $198,627 |
| 2018 | $3,344 | $221,127 | $22,500 | $198,627 |
| 2016 | $2,714 | $167,468 | $22,500 | $144,968 |
| 2015 | $2,626 | $167,468 | $22,500 | $144,968 |
| 2014 | $2,684 | $167,468 | $22,500 | $144,968 |
| 2013 | -- | $167,468 | $22,500 | $144,968 |
Source: Public Records
Map
Nearby Homes
- 511 Ward St Unit 30
- 304 Bridget Way
- 609 Quail Ct
- 700 Quail Ct
- 104 Margaret Dr
- 2040 Applewood Dr
- 810 Woodland Rd
- 0 Brassfield Rd Unit 24501569
- 726 Forrest Ln
- 1214 Hunter Ct
- 813 Pitch Pine Dr
- 815 Pitch Pine Dr
- 1198 E Middleton Dr
- 1157 Dutchville Dr
- 1171 Jackson Ct
- 1180 Andrews Ct
- 2634 Bowden Dr
- 1149 Shasta Ct
- 2723 Clifton Ave
- 1576 Munns Rd
- 446 Mayview Dr
- 425 S Elm St
- 467 Mayview Dr
- 463 Mayview Dr
- 465 Mayview Dr
- 328 Whitehall Dr
- 326 Whitehall Dr
- 324 Whitehall Dr
- 421 S Elm St
- 461 Mayview Dr
- 322 Whitehall Dr
- 459 Mayview Dr
- 320 Whitehall Dr
- 442 Mayview Dr
- 331 Howland Ct
- 457 Mayview Dr
- 318 Whitehall Dr
- 417 S Elm St
- 333 Howland Ct
- 440 Mayview Dr
Your Personal Tour Guide
Ask me questions while you tour the home.