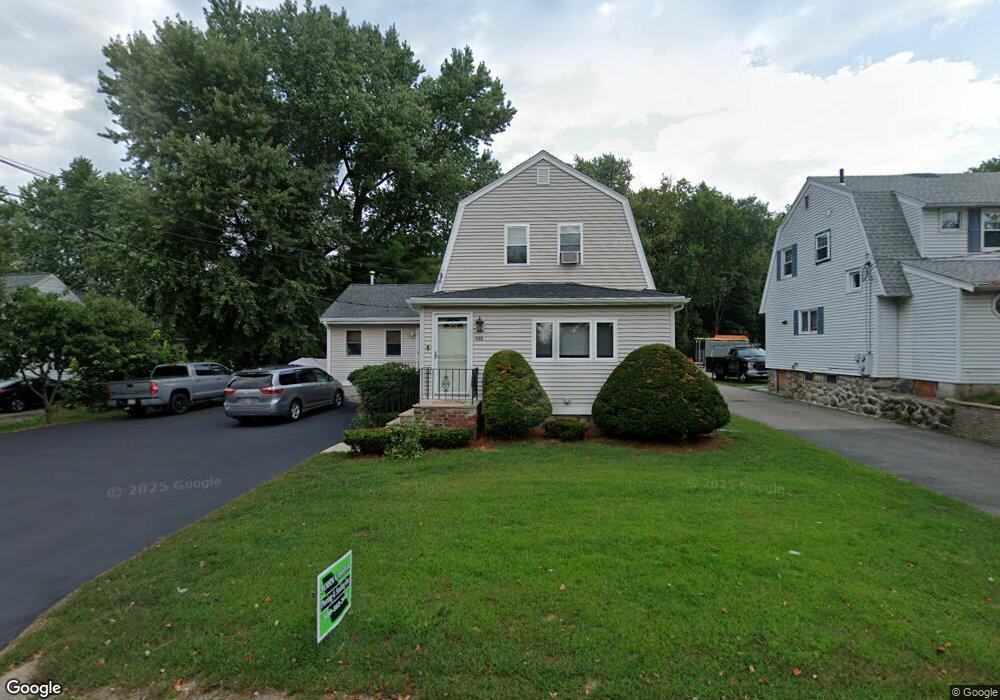
448 Middle St Braintree, MA 02184
East Braintree NeighborhoodEstimated Value: $738,122 - $893,000
3
Beds
2
Baths
2,234
Sq Ft
$371/Sq Ft
Est. Value
About This Home
This home is located at 448 Middle St, Braintree, MA 02184 and is currently estimated at $828,031, approximately $370 per square foot. 448 Middle St is a home located in Norfolk County with nearby schools including Braintree High School, Step Ahead Kindergarten, and Sacred Heart Elementary School.
Ownership History
Date
Name
Owned For
Owner Type
Purchase Details
Closed on
May 27, 2009
Sold by
Donovan Kendra J
Bought by
Chen Weiwen and Liu Linda
Current Estimated Value
Home Financials for this Owner
Home Financials are based on the most recent Mortgage that was taken out on this home.
Original Mortgage
$285,000
Interest Rate
4.87%
Mortgage Type
Purchase Money Mortgage
Purchase Details
Closed on
Apr 28, 1995
Sold by
Finocchi Karen M
Bought by
Donovan Kendra J
Home Financials for this Owner
Home Financials are based on the most recent Mortgage that was taken out on this home.
Original Mortgage
$156,650
Interest Rate
8.33%
Mortgage Type
Purchase Money Mortgage
Create a Home Valuation Report for This Property
The Home Valuation Report is an in-depth analysis detailing your home's value as well as a comparison with similar homes in the area
Home Values in the Area
Average Home Value in this Area
Purchase History
| Date | Buyer | Sale Price | Title Company |
|---|---|---|---|
| Chen Weiwen | $357,000 | -- | |
| Donovan Kendra J | $164,900 | -- |
Source: Public Records
Mortgage History
| Date | Status | Borrower | Loan Amount |
|---|---|---|---|
| Open | Donovan Kendra J | $280,000 | |
| Closed | Chen Weiwen | $285,000 | |
| Previous Owner | Donovan Kendra J | $156,500 | |
| Previous Owner | Donovan Kendra J | $156,650 |
Source: Public Records
Tax History
| Year | Tax Paid | Tax Assessment Tax Assessment Total Assessment is a certain percentage of the fair market value that is determined by local assessors to be the total taxable value of land and additions on the property. | Land | Improvement |
|---|---|---|---|---|
| 2025 | $6,566 | $657,900 | $319,700 | $338,200 |
| 2024 | $6,013 | $634,300 | $300,300 | $334,000 |
| 2023 | $5,711 | $585,100 | $271,200 | $313,900 |
| 2022 | $5,630 | $565,800 | $251,900 | $313,900 |
| 2021 | $5,237 | $526,300 | $232,500 | $293,800 |
| 2020 | $4,860 | $492,900 | $213,100 | $279,800 |
| 2019 | $4,813 | $477,000 | $213,100 | $263,900 |
| 2018 | $4,696 | $445,500 | $193,700 | $251,800 |
| 2017 | $4,404 | $410,100 | $174,400 | $235,700 |
| 2016 | $4,169 | $379,700 | $155,000 | $224,700 |
| 2015 | $4,006 | $361,900 | $146,300 | $215,600 |
| 2014 | $3,849 | $337,000 | $139,500 | $197,500 |
Source: Public Records
Map
Nearby Homes
- 298 Lisle St
- 31 Doris Rd
- 36 Chestnut Ave
- 50 Cleveland Ave
- 255 River St
- 5 Woodsum Dr Unit 12
- 20 Vine St
- 37 Lantern Ln
- 41 Lantern Ln
- 26 Tingley Rd
- 491 Washington St Unit 1
- 82 Lester Ln
- 418 John Mahar Hwy Unit 408
- 15 Summer St
- 426 John Mahar Hwy Unit 311
- 107 Summer St
- 422 John Mahar Hwy Unit 408
- 342 Elm St
- 30 Church St Unit 4
- 6 Oak St
Your Personal Tour Guide
Ask me questions while you tour the home.