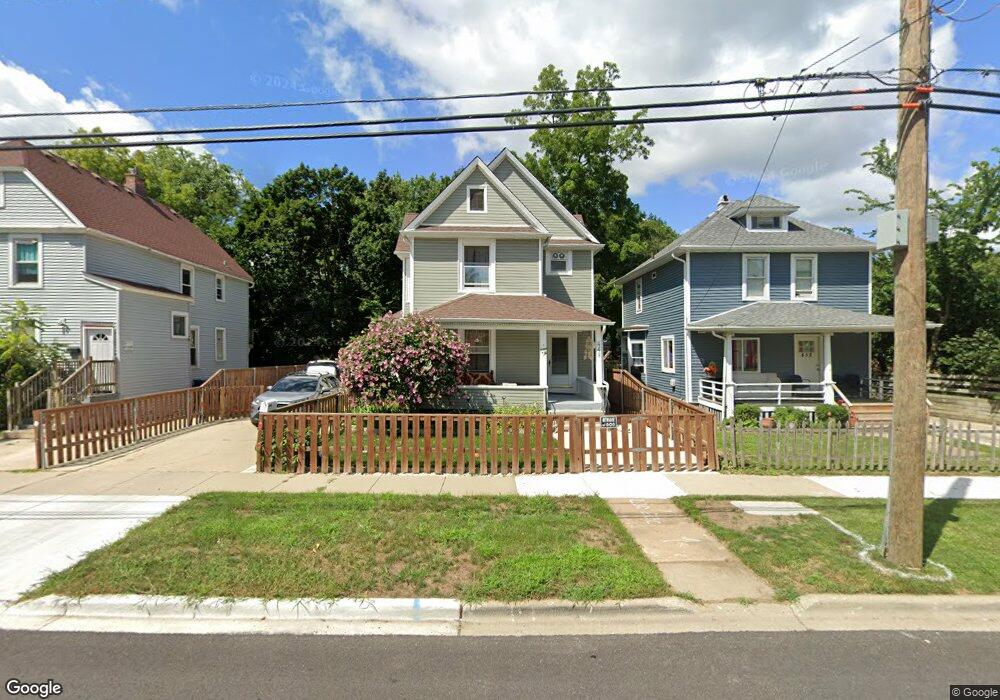
448 N Ash St Waukegan, IL 60085
Estimated Value: $218,624 - $231,000
4
Beds
2
Baths
1,488
Sq Ft
$151/Sq Ft
Est. Value
About This Home
This home is located at 448 N Ash St, Waukegan, IL 60085 and is currently estimated at $225,406, approximately $151 per square foot. 448 N Ash St is a home located in Lake County with nearby schools including Edith M Smith Middle School, Waukegan High School, and Most Blessed Trinity Academy.
Ownership History
Date
Name
Owned For
Owner Type
Purchase Details
Closed on
Jan 6, 2016
Sold by
Hernandez Salvador G and Hernandez Nunila E
Bought by
Gonzalez Salvador Hernandez and Popoca Hernandez Nunila E
Current Estimated Value
Purchase Details
Closed on
Sep 10, 1998
Sold by
Hernandez Salvador G and Hernandez Elia
Bought by
Hernandez Salvador C and Hernandez Nunila E
Create a Home Valuation Report for This Property
The Home Valuation Report is an in-depth analysis detailing your home's value as well as a comparison with similar homes in the area
Home Values in the Area
Average Home Value in this Area
Purchase History
| Date | Buyer | Sale Price | Title Company |
|---|---|---|---|
| Gonzalez Salvador Hernandez | -- | None Available | |
| Hernandez Salvador C | -- | -- |
Source: Public Records
Tax History Compared to Growth
Tax History
| Year | Tax Paid | Tax Assessment Tax Assessment Total Assessment is a certain percentage of the fair market value that is determined by local assessors to be the total taxable value of land and additions on the property. | Land | Improvement |
|---|---|---|---|---|
| 2024 | $3,010 | $53,190 | $7,298 | $45,892 |
| 2023 | $861 | $47,923 | $6,534 | $41,389 |
| 2022 | $861 | $44,017 | $6,214 | $37,803 |
| 2021 | $918 | $37,975 | $5,543 | $32,432 |
| 2020 | $998 | $35,378 | $5,164 | $30,214 |
| 2019 | $1,082 | $32,418 | $4,732 | $27,686 |
| 2018 | $1,211 | $29,197 | $6,029 | $23,168 |
| 2017 | $1,253 | $25,831 | $5,334 | $20,497 |
| 2016 | $1,361 | $22,446 | $4,635 | $17,811 |
| 2015 | $1,488 | $20,089 | $4,148 | $15,941 |
| 2014 | $1,633 | $19,807 | $3,833 | $15,974 |
| 2012 | $3,212 | $21,459 | $4,153 | $17,306 |
Source: Public Records
Map
Nearby Homes
- 428 N Poplar St
- 511 Chestnut St
- 522 N Poplar St
- 702 Franklin St
- 452 North Ave
- 620 N Poplar St
- 325 4th St
- 918 N Ash St
- 222 Grand Ave
- 723 N County St
- 611 N Genesee St
- 28 N Saint James St
- 509 N Butrick St
- 1109 Massena Ave
- 917 N Linden Ave
- 415 W Ridgeland Ave
- 23 N Jackson St
- 613 Washington St
- 824 N Butrick St
- 1110 N Ash St