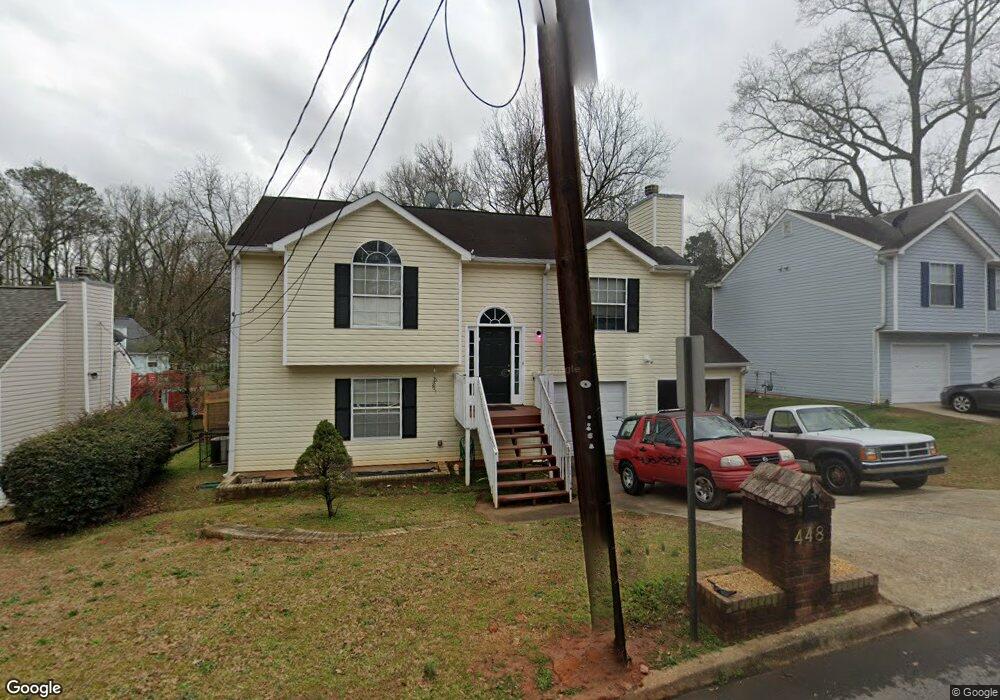
448 Oak Dr Atlanta, GA 30354
Estimated Value: $199,984 - $231,000
3
Beds
2
Baths
1,322
Sq Ft
$160/Sq Ft
Est. Value
About This Home
This home is located at 448 Oak Dr, Atlanta, GA 30354 and is currently estimated at $211,246, approximately $159 per square foot. 448 Oak Dr is a home located in Fulton County with nearby schools including Hapeville Elementary School, Paul D. West Middle School, and Tri-Cities High School.
Ownership History
Date
Name
Owned For
Owner Type
Purchase Details
Closed on
Jul 14, 2003
Sold by
Salamenca Rocio
Bought by
Hernandez Sandra
Current Estimated Value
Home Financials for this Owner
Home Financials are based on the most recent Mortgage that was taken out on this home.
Original Mortgage
$149,000
Outstanding Balance
$64,111
Interest Rate
5.42%
Mortgage Type
New Conventional
Estimated Equity
$147,135
Purchase Details
Closed on
Jun 14, 2000
Sold by
Enterprise Construction Co Inc
Bought by
Salamanca Roclo
Home Financials for this Owner
Home Financials are based on the most recent Mortgage that was taken out on this home.
Original Mortgage
$104,777
Interest Rate
8.17%
Mortgage Type
FHA
Create a Home Valuation Report for This Property
The Home Valuation Report is an in-depth analysis detailing your home's value as well as a comparison with similar homes in the area
Home Values in the Area
Average Home Value in this Area
Purchase History
| Date | Buyer | Sale Price | Title Company |
|---|---|---|---|
| Hernandez Sandra | $149,500 | -- | |
| Salamanca Roclo | $105,900 | -- |
Source: Public Records
Mortgage History
| Date | Status | Borrower | Loan Amount |
|---|---|---|---|
| Open | Hernandez Sandra | $149,000 | |
| Previous Owner | Salamanca Roclo | $104,777 |
Source: Public Records
Tax History Compared to Growth
Tax History
| Year | Tax Paid | Tax Assessment Tax Assessment Total Assessment is a certain percentage of the fair market value that is determined by local assessors to be the total taxable value of land and additions on the property. | Land | Improvement |
|---|---|---|---|---|
| 2025 | $32 | $75,640 | $18,840 | $56,800 |
| 2023 | $2,992 | $72,280 | $27,280 | $45,000 |
| 2022 | $32 | $66,960 | $17,240 | $49,720 |
| 2021 | $383 | $31,040 | $7,760 | $23,280 |
| 2020 | $32 | $30,640 | $7,640 | $23,000 |
| 2019 | $353 | $17,320 | $3,080 | $14,240 |
| 2018 | $36 | $16,920 | $3,000 | $13,920 |
| 2017 | $28 | $16,280 | $2,880 | $13,400 |
| 2016 | $29 | $16,280 | $2,880 | $13,400 |
| 2015 | $518 | $16,280 | $2,880 | $13,400 |
| 2014 | $27 | $16,280 | $2,880 | $13,400 |
Source: Public Records
Map
Nearby Homes