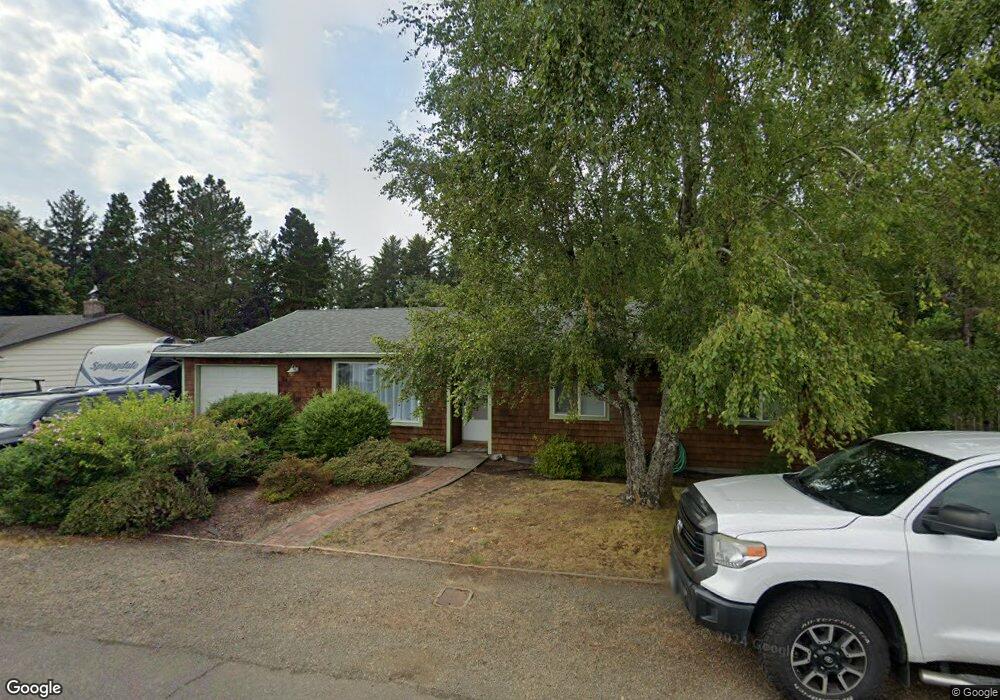
448 Ridge Dr Seaside, OR 97138
Estimated Value: $392,000 - $425,000
3
Beds
1
Bath
1,083
Sq Ft
$378/Sq Ft
Est. Value
About This Home
This home is located at 448 Ridge Dr, Seaside, OR 97138 and is currently estimated at $408,954, approximately $377 per square foot. 448 Ridge Dr is a home located in Clatsop County with nearby schools including Seaside High School.
Ownership History
Date
Name
Owned For
Owner Type
Purchase Details
Closed on
Apr 30, 2025
Sold by
Smith & Edy Trust and Smith Kerry
Bought by
Christensen Alexander G and Christensen Rachel B
Current Estimated Value
Home Financials for this Owner
Home Financials are based on the most recent Mortgage that was taken out on this home.
Original Mortgage
$200,000
Outstanding Balance
$195,783
Interest Rate
5.89%
Mortgage Type
New Conventional
Estimated Equity
$213,171
Purchase Details
Closed on
Dec 20, 2019
Sold by
Smith Kerry Dean and Smith Edy Susan
Bought by
Smith Kerry Dean and Smith Edy Susan
Create a Home Valuation Report for This Property
The Home Valuation Report is an in-depth analysis detailing your home's value as well as a comparison with similar homes in the area
Purchase History
| Date | Buyer | Sale Price | Title Company |
|---|---|---|---|
| Christensen Alexander G | $400,000 | Ticor Title | |
| Smith Kerry Dean | -- | None Available |
Source: Public Records
Mortgage History
| Date | Status | Borrower | Loan Amount |
|---|---|---|---|
| Open | Christensen Alexander G | $200,000 |
Source: Public Records
Tax History Compared to Growth
Tax History
| Year | Tax Paid | Tax Assessment Tax Assessment Total Assessment is a certain percentage of the fair market value that is determined by local assessors to be the total taxable value of land and additions on the property. | Land | Improvement |
|---|---|---|---|---|
| 2025 | $2,294 | $210,046 | -- | -- |
| 2024 | $2,332 | $203,929 | -- | -- |
| 2023 | $2,267 | $197,990 | $0 | $0 |
| 2022 | $2,199 | $192,224 | $0 | $0 |
| 2021 | $2,245 | $186,626 | $0 | $0 |
| 2020 | $2,165 | $181,191 | $0 | $0 |
| 2019 | $2,110 | $175,915 | $0 | $0 |
| 2018 | $2,033 | $170,793 | $0 | $0 |
| 2017 | $1,980 | $165,820 | $0 | $0 |
| 2016 | $1,710 | $160,991 | $61,519 | $99,472 |
| 2015 | $1,654 | $156,303 | $59,728 | $96,575 |
| 2014 | $1,572 | $151,752 | $0 | $0 |
| 2013 | -- | $147,333 | $0 | $0 |
Source: Public Records
Map
Nearby Homes
- 1065 Picture Place
- 735 3rd St
- 1324 Sea Ridge Ln
- 1255 A St
- 3387-3389 U S 101
- 3389 U S 101
- 1265 D St
- 1396 N Ocean Ave
- 4045 U S 101
- 4045 Highway 101 N
- 645 Meadow Ln
- 1146 N Marion Ave Unit 1-606
- 856 Neacoxie Blvd
- 856 Neacoxie Blvd Unit 324
- 856 Neacoxie Blvd Unit 311
- 0 McCormick Gardens Rd
- 782 Woodland Ct
- 0 Hillila Rd
- 1398 N Ocean Ave
- 1400 N Ocean Ave