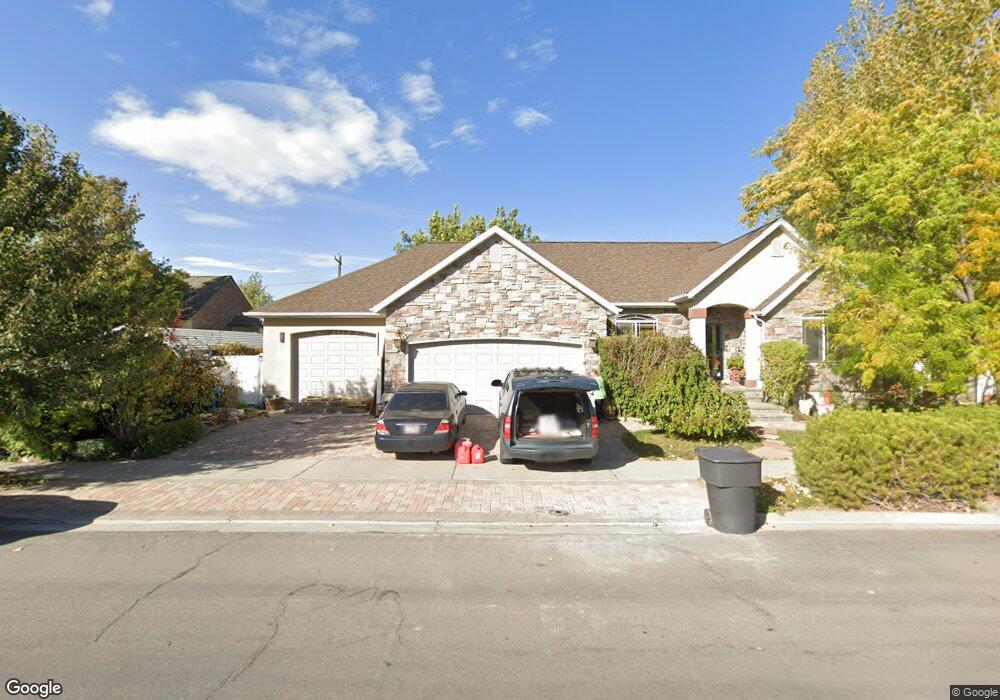
448 W 1650 S Payson, UT 84651
Estimated Value: $479,000 - $577,453
3
Beds
2
Baths
1,588
Sq Ft
$337/Sq Ft
Est. Value
About This Home
This home is located at 448 W 1650 S, Payson, UT 84651 and is currently estimated at $534,484, approximately $336 per square foot. 448 W 1650 S is a home located in Utah County with nearby schools including Spring Lake Elementary, Payson High School, and Payson Junior High School.
Ownership History
Date
Name
Owned For
Owner Type
Purchase Details
Closed on
Feb 28, 2001
Sold by
Potter John C
Bought by
Potter John C and Potter Lana G
Current Estimated Value
Home Financials for this Owner
Home Financials are based on the most recent Mortgage that was taken out on this home.
Original Mortgage
$118,000
Outstanding Balance
$43,096
Interest Rate
7.06%
Estimated Equity
$491,388
Purchase Details
Closed on
Oct 13, 2000
Sold by
Steve R Biegler Construction Llc
Bought by
Potter John C
Home Financials for this Owner
Home Financials are based on the most recent Mortgage that was taken out on this home.
Original Mortgage
$120,000
Interest Rate
7.89%
Create a Home Valuation Report for This Property
The Home Valuation Report is an in-depth analysis detailing your home's value as well as a comparison with similar homes in the area
Home Values in the Area
Average Home Value in this Area
Purchase History
| Date | Buyer | Sale Price | Title Company |
|---|---|---|---|
| Potter John C | -- | Wasatch Land & Title | |
| Potter John C | -- | Wasatch Land & Title |
Source: Public Records
Mortgage History
| Date | Status | Borrower | Loan Amount |
|---|---|---|---|
| Open | Potter John C | $118,000 | |
| Closed | Potter John C | $120,000 |
Source: Public Records
Tax History
| Year | Tax Paid | Tax Assessment Tax Assessment Total Assessment is a certain percentage of the fair market value that is determined by local assessors to be the total taxable value of land and additions on the property. | Land | Improvement |
|---|---|---|---|---|
| 2025 | $2,669 | $296,340 | -- | -- |
| 2024 | $2,669 | $271,645 | $0 | $0 |
| 2023 | $2,696 | $275,110 | $0 | $0 |
| 2022 | $2,629 | $263,835 | $0 | $0 |
| 2021 | $2,224 | $358,100 | $118,100 | $240,000 |
| 2020 | $2,109 | $332,100 | $107,400 | $224,700 |
| 2019 | $1,942 | $313,600 | $88,900 | $224,700 |
| 2018 | $1,761 | $274,000 | $77,800 | $196,200 |
| 2017 | $1,614 | $135,135 | $0 | $0 |
| 2016 | $1,566 | $130,185 | $0 | $0 |
| 2015 | $1,437 | $118,690 | $0 | $0 |
| 2014 | $1,281 | $106,590 | $0 | $0 |
Source: Public Records
Map
Nearby Homes
- 609 W Saddlebrook Dr
- 613 W Saddlebrook Dr
- 32 E 1690 S Unit 113
- 588 W 1450 S
- 1631 S Highway 198
- 1463 S 260 W
- 1835 S 410 W
- 1848 S 410 W
- 211 W 1800 S
- 347 W 1380 S
- 1632 S 240 W Unit 47
- 1652 S 240 W Unit 48
- 1848 S 100 E Unit 3
- 1872 100 E Unit 6
- 802 Brookside Ct
- 1579 S 910 W
- 1468 S 910 W
- 528 W 1150 S
- 1605 S 1100 W
- 336 E 1330 S
- 468 W 1650 S
- 428 W 1650 S
- 1567 S 500 W
- 435 W 1650 S
- 392 W 1650 S
- 1553 S 500 W
- 415 W 1650 S
- 389 Pommel Dr
- 455 Saddlebrook Dr
- 397 Saddlebrook Dr
- 397 Pommel Dr
- 372 W 1600 S
- 372 W 1600 S Unit 37
- 1568 S 500 W
- 385 Pommel Dr
- 409 Pommel Dr
- 423 Pommel Dr Unit 36
- 1635 S 500 W
- 1635 S 500 W Unit 7
- 441 Saddlebrook Dr
Your Personal Tour Guide
Ask me questions while you tour the home.