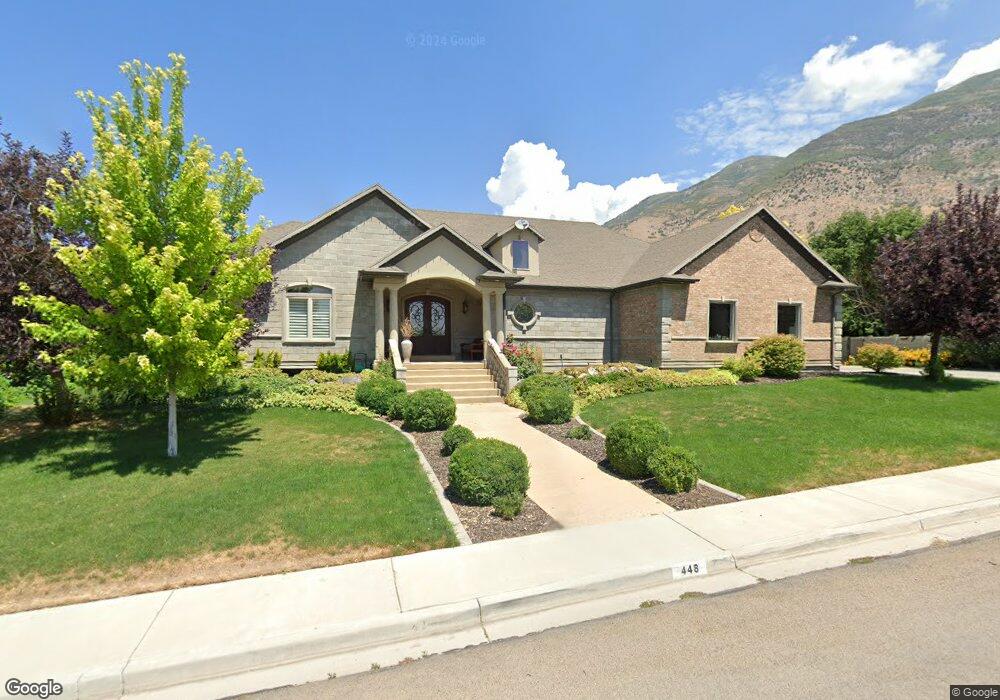
448 W 2900 N Pleasant Grove, UT 84062
Estimated Value: $1,075,000 - $1,498,000
3
Beds
3
Baths
2,233
Sq Ft
$547/Sq Ft
Est. Value
About This Home
This home is located at 448 W 2900 N, Pleasant Grove, UT 84062 and is currently estimated at $1,221,989, approximately $547 per square foot. 448 W 2900 N is a home located in Utah County with nearby schools including Deerfield Elementary School, Mountain Ridge Junior High School, and American Fork High School.
Ownership History
Date
Name
Owned For
Owner Type
Purchase Details
Closed on
Aug 23, 2021
Sold by
Smith Jerry P
Bought by
Smith Family Trust and Smith
Current Estimated Value
Purchase Details
Closed on
Mar 27, 2012
Sold by
Bucy Justin
Bought by
Bucy Justin and Bucy Wendy
Home Financials for this Owner
Home Financials are based on the most recent Mortgage that was taken out on this home.
Original Mortgage
$220,008
Interest Rate
3.75%
Mortgage Type
FHA
Purchase Details
Closed on
Jul 5, 2005
Sold by
Bullington John
Bought by
Smith Jerry P and Smith Barbara J
Purchase Details
Closed on
May 9, 2005
Sold by
Holman Jenevieve
Bought by
Bullington John
Purchase Details
Closed on
Jul 2, 2004
Sold by
Bishop Jared L
Bought by
Bullington John and Holman Jenevieve
Purchase Details
Closed on
May 19, 1997
Sold by
Water Gardens Development Corp
Bought by
Smith Jerry P and Smith Barbara J
Create a Home Valuation Report for This Property
The Home Valuation Report is an in-depth analysis detailing your home's value as well as a comparison with similar homes in the area
Home Values in the Area
Average Home Value in this Area
Purchase History
| Date | Buyer | Sale Price | Title Company |
|---|---|---|---|
| Smith Family Trust | -- | Wasatch Land & Title | |
| Bucy Justin | -- | None Available | |
| Smith Jerry P | -- | Backman Title Services Ltd | |
| Bullington John | -- | -- | |
| Bullington John | -- | Backman Stewart Title Servi | |
| Smith Jerry P | -- | -- |
Source: Public Records
Mortgage History
| Date | Status | Borrower | Loan Amount |
|---|---|---|---|
| Previous Owner | Bucy Justin | $220,008 |
Source: Public Records
Tax History Compared to Growth
Tax History
| Year | Tax Paid | Tax Assessment Tax Assessment Total Assessment is a certain percentage of the fair market value that is determined by local assessors to be the total taxable value of land and additions on the property. | Land | Improvement |
|---|---|---|---|---|
| 2025 | $4,390 | $582,725 | $456,200 | $603,300 |
| 2024 | $4,390 | $523,820 | $0 | $0 |
| 2023 | $4,263 | $520,795 | $0 | $0 |
| 2022 | $4,292 | $521,785 | $0 | $0 |
| 2021 | $3,619 | $669,800 | $259,600 | $410,200 |
| 2020 | $2,816 | $510,900 | $240,400 | $270,500 |
| 2019 | $2,631 | $493,700 | $223,200 | $270,500 |
| 2018 | $2,686 | $476,600 | $206,100 | $270,500 |
| 2017 | $2,494 | $235,620 | $0 | $0 |
| 2016 | $2,559 | $233,420 | $0 | $0 |
| 2015 | $2,644 | $228,305 | $0 | $0 |
| 2014 | $2,712 | $232,045 | $0 | $0 |
Source: Public Records
Map
Nearby Homes
- 2837 N 550 W
- 9078 Renaissance Dr
- 8923 N Cottage Canyon Dr
- 9157 N Canyon Heights Dr
- 3408 W Bear Canyon Ln N Unit 53
- 8905 N Pine Hollow Dr
- 3373 Bear Canyon Ln
- 3810 W Valley View Dr
- 8944 Silver Lake Dr
- 9481 N 3830 W
- 9547 N Canyon Rd
- 532 W 2000 N
- 2969 N 1350 W
- 9506 N 4000 W
- 9575 Aztec Dr
- 1897 N 900 W
- 4124 N 810 W
- 980 W 1800 N
- 1727 N Siena Cir Unit 4
- 598 N 1280 E
- 443 Millcreek Rd
- 478 W 2900 N
- 414 W 2900 N
- 463 Millcreek Rd
- 417 W Millcreek Rd
- 417 Millcreek Rd
- 421 W 2900 N
- 473 W 2900 N
- 391 Millcreek Rd
- 378 W 2900 N
- 395 W 2900 N
- 522 W 2900 N
- 501 W 2900 N
- 3001 Millcreek Rd
- 3008 N 550 W Unit 209
- 367 Millcreek Rd
- 371 W 2900 N Unit 8
- 523 W 2900 N
- 3033 Millcreek Rd
- 358 W 2900 N