4480 Southport-Supply Rd SE Southport, NC 28461
Estimated payment $15,343/month
About This Lot
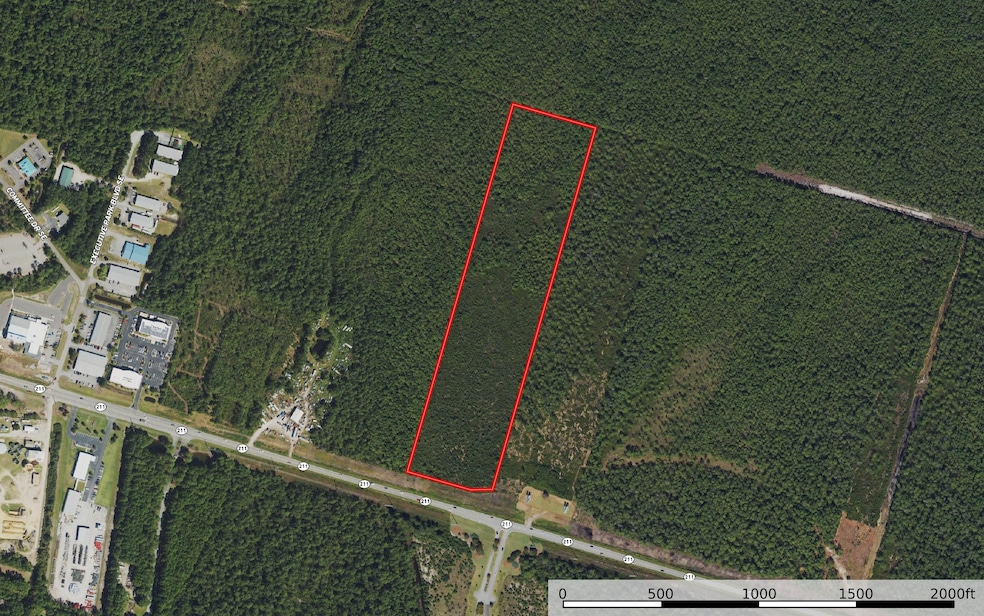
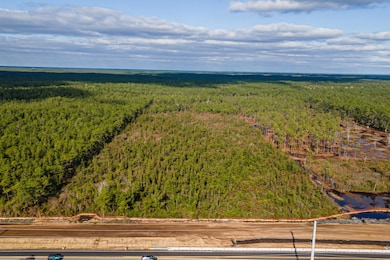
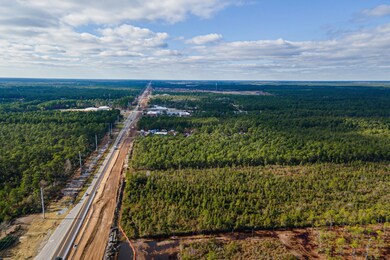
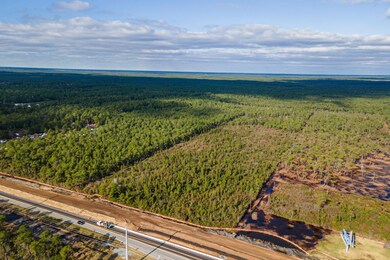
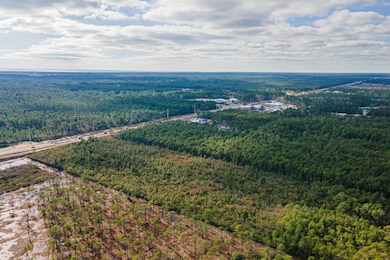
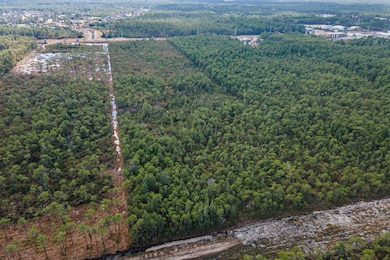
Prime commercial acreage at St. James/Southport for sale! This property is ideal for commercial development, located directly off of Highway 211 (Southport-Supply Rd) near the St. James Plantation entrance. Topography is level & wooded with 440ft of road frontage & tons of road visibility/passerby traffic! Municipal water & sewer available. Property lies just outside of the city limits just minutes from Southport, St. James & Oak Island. Current road widening will be complete around Fall 2026 resulting in 4-lane highway frontage & increased road visibility/traffic for this property. Do not miss this incredible opportunity! Contact Listing Agents for more information!
Listing Agent
The Group
United Country RE-The McLemore Group Listed on: 12/12/2023

Property Details
Property Type
- Land
Lot Details
- Property fronts a state road
- Many Trees
Utilities
- Underground Utilities
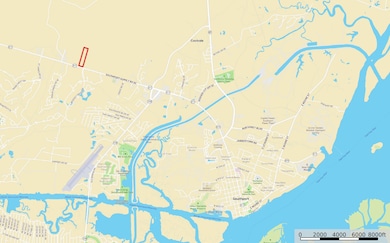
Map
Home Values in the Area
Average Home Value in this Area
Tax History
| Year | Tax Paid | Tax Assessment Tax Assessment Total Assessment is a certain percentage of the fair market value that is determined by local assessors to be the total taxable value of land and additions on the property. | Land | Improvement |
|---|---|---|---|---|
| 2025 | -- | $177,570 | $177,570 | $0 |
| 2024 | $698 | $177,570 | $177,570 | $0 |
| 2023 | $849 | $177,570 | $177,570 | $0 |
| 2022 | $0 | $157,840 | $157,840 | $0 |
| 2021 | $938 | $157,840 | $157,840 | $0 |
| 2020 | $0 | $157,840 | $157,840 | $0 |
| 2019 | $842 | $157,840 | $157,840 | $0 |
| 2018 | $919 | $172,460 | $172,460 | $0 |
| 2017 | $918 | $172,460 | $172,460 | $0 |
| 2016 | $938 | $176,840 | $176,840 | $0 |
| 2015 | $938 | $176,840 | $176,840 | $0 |
| 2014 | $521 | $230,280 | $230,280 | $0 |
Property History
| Date | Event | Price | List to Sale | Price per Sq Ft |
|---|---|---|---|---|
| 03/17/2025 03/17/25 | For Sale | $2,900,000 | 0.0% | -- |
| 12/12/2023 12/12/23 | For Sale | $2,900,000 | -- | -- |
Purchase History
| Date | Type | Sale Price | Title Company |
|---|---|---|---|
| Deed | -- | None Listed On Document | |
| Warranty Deed | -- | None Available | |
| Warranty Deed | $125,000 | None Available |
Mortgage History
| Date | Status | Loan Amount | Loan Type |
|---|---|---|---|
| Previous Owner | $32,000 | Unknown | |
| Previous Owner | $32,000 | Future Advance Clause Open End Mortgage |
- 4480 Southport-Supply Rd SE Unit 32
- 4277 Kingston Ct
- 4433 Devonswood Dr
- 3929 Harmony Cir
- 3923 Harmony Cir
- 4255 Ashfield Place
- Isla Plan at Arbor Creek
- Laurel Plan at Arbor Creek
- Palm Plan at Arbor Creek
- Danforth Plan at Arbor Creek
- 3803 Harmony Cir
- 3905 Meeting Place
- 3918 Meeting Place Ln
- 3914 Meeting Place
- 4094 Honey Locust Way
- 3965 Pepperberry Ln
- 3973 Pepperberry Ln
- Pierre's Bay Plan at St. James Plantation - St. James
- Westbury Plan at St. James Plantation
- Bar Harbour II Plan at St. James Plantation - St. James
- 4279 Ashfield Place
- 3929 Harmony Cir
- 4925 Abbington Oaks Way
- 4460 Golf Cottage Dr Unit 1
- 4458 Maritime Oak Dr
- 3839 Berkeley Ct
- 4917 Dreamweaver Ct Unit 6
- 4850 Tobago Dr SE
- 3792 Bancroft Place
- 5045 Ballast Rd
- 3025 Headwater Dr SE
- 3266 Wild Azalea Way SE
- 5118 Elton Dr SE
- 3185 Wexford Way
- 3201 Wild Azalea Way SE
- 5189 Minnesota Dr SE
- 3145 Lakeside Commons Dr SE Unit 1
- 3030 Marsh Winds Cir Unit 102
- 3030 Marsh Winds Cir Unit 302
- 3030 Marsh Winds Cir Unit 1103