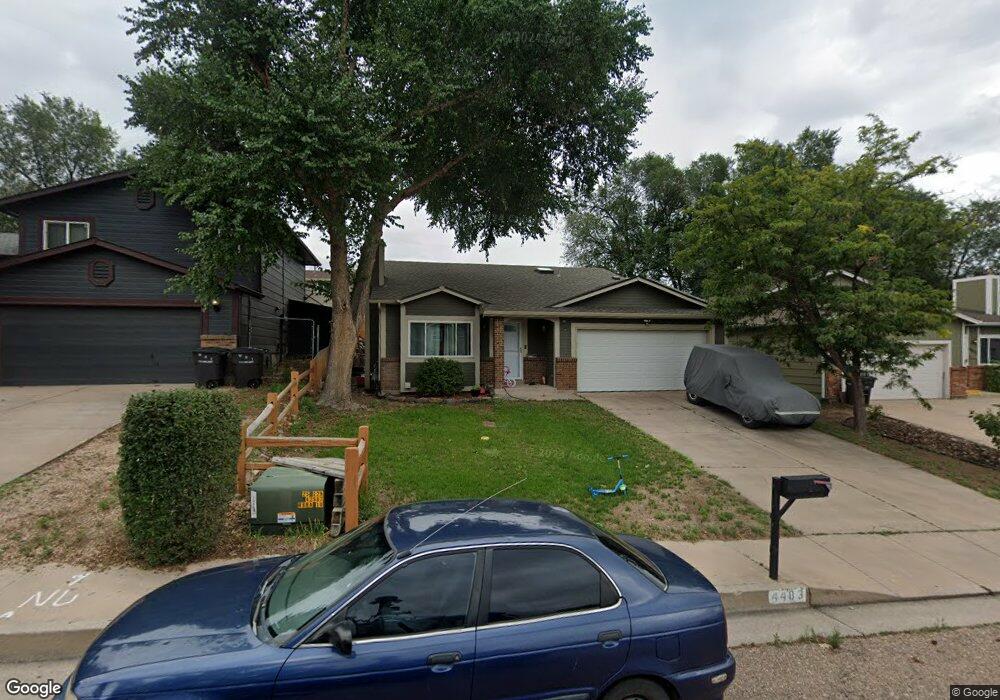
4483 Mcgrew Cir Colorado Springs, CO 80911
Security-Widefield NeighborhoodEstimated Value: $358,474 - $376,000
3
Beds
2
Baths
876
Sq Ft
$419/Sq Ft
Est. Value
About This Home
This home is located at 4483 Mcgrew Cir, Colorado Springs, CO 80911 and is currently estimated at $366,869, approximately $418 per square foot. 4483 Mcgrew Cir is a home located in El Paso County with nearby schools including Pinello Elementary School, Sproul Junior High School, and Widefield High School.
Ownership History
Date
Name
Owned For
Owner Type
Purchase Details
Closed on
Sep 28, 2015
Sold by
Barfield William J and Barfield June S
Bought by
Brown Dustin R
Current Estimated Value
Home Financials for this Owner
Home Financials are based on the most recent Mortgage that was taken out on this home.
Original Mortgage
$168,884
Outstanding Balance
$133,949
Interest Rate
4.12%
Mortgage Type
FHA
Estimated Equity
$232,920
Purchase Details
Closed on
Jun 3, 2005
Sold by
Owens Robb E
Bought by
Barfield William J and Barfield June S
Home Financials for this Owner
Home Financials are based on the most recent Mortgage that was taken out on this home.
Original Mortgage
$163,440
Interest Rate
5.83%
Mortgage Type
VA
Purchase Details
Closed on
Jul 17, 2002
Sold by
Pagan Maria C
Bought by
Owens Robb E
Home Financials for this Owner
Home Financials are based on the most recent Mortgage that was taken out on this home.
Original Mortgage
$135,037
Interest Rate
6.48%
Purchase Details
Closed on
Feb 28, 1995
Sold by
Stovern Gary A and Stovern Sandra K
Bought by
Pagan Maria C
Create a Home Valuation Report for This Property
The Home Valuation Report is an in-depth analysis detailing your home's value as well as a comparison with similar homes in the area
Home Values in the Area
Average Home Value in this Area
Purchase History
| Date | Buyer | Sale Price | Title Company |
|---|---|---|---|
| Brown Dustin R | $172,000 | Unified Title Co | |
| Barfield William J | $160,000 | -- | |
| Owens Robb E | $138,500 | Chicago Title Co | |
| Pagan Maria C | $108,500 | -- |
Source: Public Records
Mortgage History
| Date | Status | Borrower | Loan Amount |
|---|---|---|---|
| Open | Brown Dustin R | $168,884 | |
| Previous Owner | Barfield William J | $163,440 | |
| Previous Owner | Owens Robb E | $135,037 |
Source: Public Records
Tax History Compared to Growth
Tax History
| Year | Tax Paid | Tax Assessment Tax Assessment Total Assessment is a certain percentage of the fair market value that is determined by local assessors to be the total taxable value of land and additions on the property. | Land | Improvement |
|---|---|---|---|---|
| 2025 | $1,588 | $24,940 | -- | -- |
| 2024 | $1,529 | $25,130 | $4,020 | $21,110 |
| 2023 | $1,529 | $25,130 | $4,020 | $21,110 |
| 2022 | $1,329 | $17,800 | $2,780 | $15,020 |
| 2021 | $1,433 | $18,310 | $2,860 | $15,450 |
| 2020 | $1,170 | $14,520 | $2,500 | $12,020 |
| 2019 | $1,163 | $14,520 | $2,500 | $12,020 |
| 2018 | $1,024 | $11,930 | $1,870 | $10,060 |
| 2017 | $1,035 | $11,930 | $1,870 | $10,060 |
| 2016 | $832 | $11,700 | $1,990 | $9,710 |
| 2015 | $852 | $11,700 | $1,990 | $9,710 |
| 2014 | $784 | $10,800 | $1,790 | $9,010 |
Source: Public Records
Map
Nearby Homes
- 4145 Dooley Way
- 4385 Cassidy St
- 4226 Dooley Way
- 4375 Cassidy St
- 4331 Mcgrew Cir
- 4634 Cassidy St
- 4658 Hennings Dr
- 4666 Hennings Dr
- 4790 Hennings Dr
- 2246 Bison Dr
- 2522 Ivanhoe Dr
- 4020 Silver Star Grove
- 213 Sumac Dr
- 124 Sumac Dr
- 105 Larch Dr
- 324 Davie Dr
- 308 Steven Dr
- 4613 Pleasant Port View Unit 2
- 93 Sumac Dr
- 405 Birch Dr
- 4479 Mcgrew Cir
- 4487 Mcgrew Cir
- 4480 Hennings Dr
- 4475 Mcgrew Cir
- 4470 Hennings Dr
- 4515 Cassidy St
- 4490 Hennings Dr
- 4460 Hennings Dr
- 4490 Mcgrew Cir
- 4525 Cassidy St
- 4471 Mcgrew Cir
- 4450 Hennings Dr
- 4552 Hennings Dr
- 4475 Cassidy St
- 4535 Cassidy St
- 4482 Mcgrew Cir
- 4467 Mcgrew Cir
- 4440 Hennings Dr
- 4465 Cassidy St
- 4545 Cassidy St