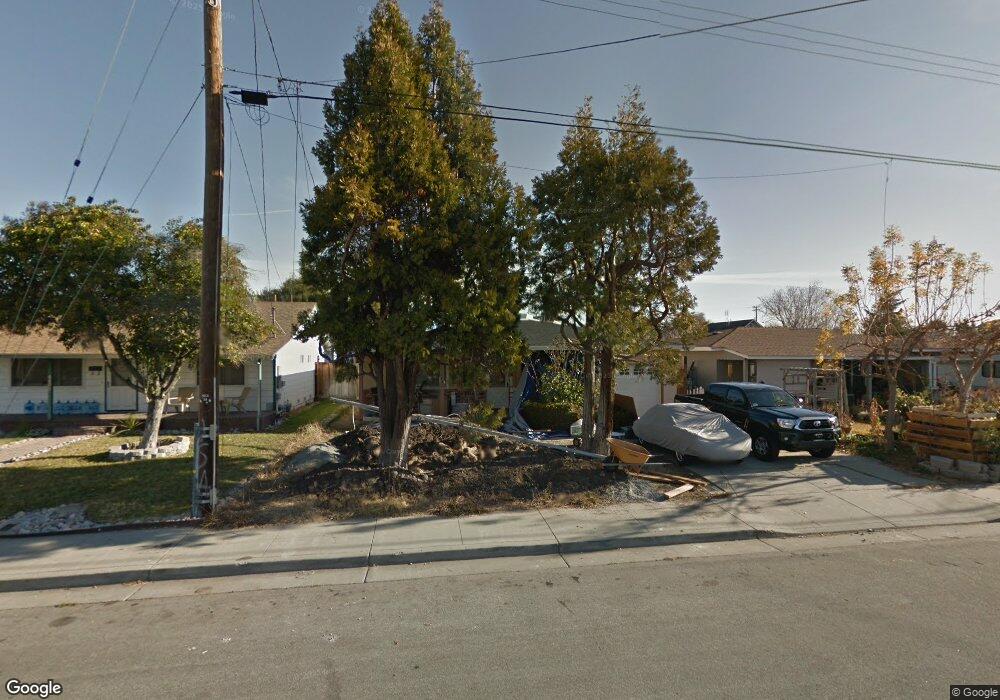
4485 Fillmore St Santa Clara, CA 95054
North Santa Clara NeighborhoodEstimated Value: $1,266,000 - $1,610,000
3
Beds
2
Baths
833
Sq Ft
$1,718/Sq Ft
Est. Value
About This Home
This home is located at 4485 Fillmore St, Santa Clara, CA 95054 and is currently estimated at $1,431,257, approximately $1,718 per square foot. 4485 Fillmore St is a home located in Santa Clara County with nearby schools including Kathryn Hughes Elementary School, Buchser Middle School, and Santa Clara High School.
Ownership History
Date
Name
Owned For
Owner Type
Purchase Details
Closed on
Dec 2, 2004
Sold by
Ryan Patrick
Bought by
Francisco Philip and Torres Melissa
Current Estimated Value
Home Financials for this Owner
Home Financials are based on the most recent Mortgage that was taken out on this home.
Original Mortgage
$380,800
Outstanding Balance
$187,370
Interest Rate
5.99%
Mortgage Type
Purchase Money Mortgage
Estimated Equity
$1,243,887
Purchase Details
Closed on
Apr 30, 2004
Sold by
Gerardi John A
Bought by
Gerardi John A
Create a Home Valuation Report for This Property
The Home Valuation Report is an in-depth analysis detailing your home's value as well as a comparison with similar homes in the area
Home Values in the Area
Average Home Value in this Area
Purchase History
| Date | Buyer | Sale Price | Title Company |
|---|---|---|---|
| Francisco Philip | $476,000 | Alliance Title Company | |
| Gerardi John A | -- | -- |
Source: Public Records
Mortgage History
| Date | Status | Borrower | Loan Amount |
|---|---|---|---|
| Open | Francisco Philip | $380,800 | |
| Closed | Francisco Philip | $95,200 |
Source: Public Records
Tax History
| Year | Tax Paid | Tax Assessment Tax Assessment Total Assessment is a certain percentage of the fair market value that is determined by local assessors to be the total taxable value of land and additions on the property. | Land | Improvement |
|---|---|---|---|---|
| 2025 | $8,739 | $754,821 | $265,391 | $489,430 |
| 2024 | $8,739 | $740,022 | $260,188 | $479,834 |
| 2023 | $8,651 | $725,513 | $255,087 | $470,426 |
| 2022 | $8,507 | $711,288 | $250,086 | $461,202 |
| 2021 | $8,473 | $697,342 | $245,183 | $452,159 |
| 2020 | $8,320 | $690,192 | $242,669 | $447,523 |
| 2019 | $8,309 | $676,660 | $237,911 | $438,749 |
| 2018 | $7,777 | $663,394 | $233,247 | $430,147 |
| 2017 | $7,739 | $650,387 | $228,674 | $421,713 |
| 2016 | $7,588 | $637,636 | $224,191 | $413,445 |
| 2015 | $7,447 | $618,500 | $217,400 | $401,100 |
| 2014 | $6,377 | $545,000 | $210,000 | $335,000 |
Source: Public Records
Map
Nearby Homes
- 2235 3rd St
- 2252 Creek Bed Ct
- 2231 Esperanca Ave
- 2200 Agnew Rd Unit 318
- 1883 Agnew Rd Unit 311
- 1883 Agnew Rd Unit 112
- 1933 Silva Place
- 2130 Payne Place
- 4663 Mangrum Dr
- 4918 Avenida de Los Arboles
- 4424 Lick Mill Blvd
- 4325 Watson Cir
- 575 Moreland Way
- 541 Woodstock Way
- 3766 Pinewood Place
- 1225 Manzano Way
- 4169 Boneso Cir
- 1215 Oak Creek Way
- 1377 Sandia Ave
- 1282 Sandia Ave
Your Personal Tour Guide
Ask me questions while you tour the home.