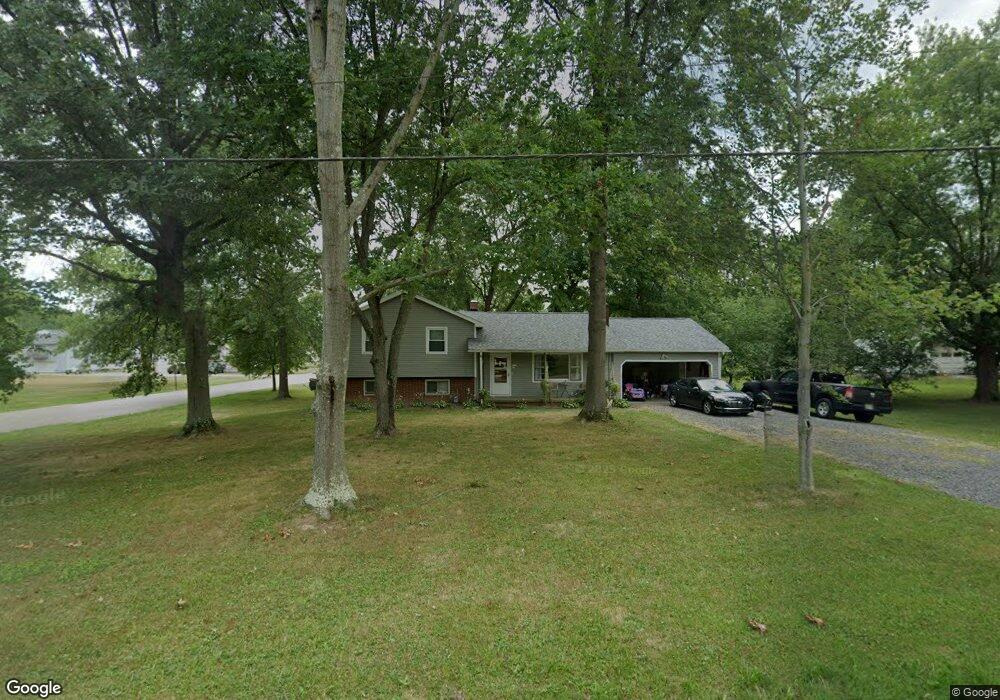
4485 Meese Rd Louisville, OH 44641
Estimated Value: $195,000 - $249,000
3
Beds
2
Baths
1,196
Sq Ft
$188/Sq Ft
Est. Value
About This Home
This home is located at 4485 Meese Rd, Louisville, OH 44641 and is currently estimated at $224,760, approximately $187 per square foot. 4485 Meese Rd is a home located in Stark County with nearby schools including Louisville High School and St. Thomas Aquinas High School & Middle School.
Ownership History
Date
Name
Owned For
Owner Type
Purchase Details
Closed on
Apr 24, 2024
Sold by
Keller Tammy and Stringer Tammy
Bought by
Krug Benjamin Donald and Krug Danielle Marie
Current Estimated Value
Home Financials for this Owner
Home Financials are based on the most recent Mortgage that was taken out on this home.
Original Mortgage
$185,000
Outstanding Balance
$182,934
Interest Rate
8.38%
Mortgage Type
New Conventional
Estimated Equity
$41,826
Purchase Details
Closed on
Jan 26, 2018
Sold by
Bowling Guy D and Bowling Suzanne
Bought by
Keller Tammy
Purchase Details
Closed on
Aug 7, 2009
Sold by
Bowling Douglas B and Bowling Ida
Bought by
Bowling Guy D and Bowling Suzanne
Purchase Details
Closed on
Jun 29, 2009
Sold by
Wilson Donald W
Bought by
Bowling Douglas B
Create a Home Valuation Report for This Property
The Home Valuation Report is an in-depth analysis detailing your home's value as well as a comparison with similar homes in the area
Home Values in the Area
Average Home Value in this Area
Purchase History
| Date | Buyer | Sale Price | Title Company |
|---|---|---|---|
| Krug Benjamin Donald | $185,000 | None Listed On Document | |
| Keller Tammy | -- | None Available | |
| Bowling Guy D | -- | None Available | |
| Bowling Douglas B | $35,000 | Attorney |
Source: Public Records
Mortgage History
| Date | Status | Borrower | Loan Amount |
|---|---|---|---|
| Open | Krug Benjamin Donald | $185,000 |
Source: Public Records
Tax History Compared to Growth
Tax History
| Year | Tax Paid | Tax Assessment Tax Assessment Total Assessment is a certain percentage of the fair market value that is determined by local assessors to be the total taxable value of land and additions on the property. | Land | Improvement |
|---|---|---|---|---|
| 2025 | -- | $57,580 | $19,710 | $37,870 |
| 2024 | -- | $57,580 | $19,710 | $37,870 |
| 2023 | $1,973 | $44,810 | $18,590 | $26,220 |
| 2022 | $989 | $44,810 | $18,590 | $26,220 |
| 2021 | $1,984 | $44,810 | $18,590 | $26,220 |
| 2020 | $1,699 | $41,550 | $16,730 | $24,820 |
| 2019 | $1,702 | $41,410 | $16,730 | $24,680 |
| 2018 | $1,696 | $41,410 | $16,730 | $24,680 |
| 2017 | $1,538 | $36,230 | $14,700 | $21,530 |
| 2016 | $1,569 | $36,230 | $14,700 | $21,530 |
| 2015 | $1,574 | $36,230 | $14,700 | $21,530 |
| 2014 | $1,464 | $31,330 | $12,710 | $18,620 |
| 2013 | $736 | $31,330 | $12,710 | $18,620 |
Source: Public Records
Map
Nearby Homes
- 2015 E Main St
- 1812 E Broad St
- 2110 Edmar St
- 1413 Washington Blvd
- 0 Michigan Blvd
- 308 Superior St
- 520 S Silver St
- 8896 Rue Helena St
- 728 E Broad St
- 3390 Meese Rd NE
- 910 Crosswyck Cir
- 325 Lincoln Ave
- 5495 Meese Rd NE
- 210 E Gorgas St
- 204 E Broad St
- 107 E Broad St
- 908 Sand Lot Cir
- 316 E Reno Dr
- 428 Honeycrisp Dr NE
- 3047 Mcintosh Dr NE
- 4485 Meese Rd NE
- 4504 Meese Rd NE
- 315 Meese Rd
- 2119 Monter Ave
- 4510 Meese Rd NE
- 4425 Meese Rd
- 4510 Meese Rd
- 2107 Monter Ave
- 304 Brookfield St
- 304 Brookfield St
- 304 Brookfield St
- 304 Brookfield St
- 4424 Meese Rd NE
- 4524 Meese Rd
- 220 Brookfield St
- 314 Brookfield St
- 314 Brookfield St
- 314 Brookfield St
- 314 Brookfield St
- 4555 Meese Rd NE