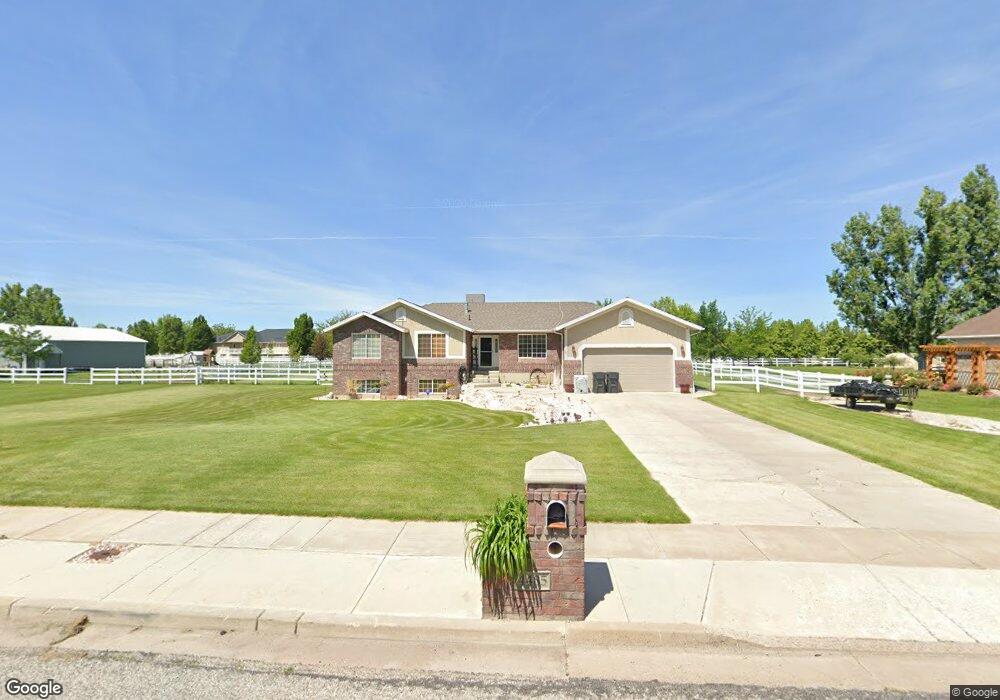
4485 S 4300 W West Haven, UT 84401
Estimated Value: $624,000 - $741,941
5
Beds
4
Baths
1,797
Sq Ft
$384/Sq Ft
Est. Value
About This Home
This home is located at 4485 S 4300 W, West Haven, UT 84401 and is currently estimated at $690,485, approximately $384 per square foot. 4485 S 4300 W is a home located in Weber County with nearby schools including Country View School, Rocky Mountain Junior High School, and Fremont High School.
Ownership History
Date
Name
Owned For
Owner Type
Purchase Details
Closed on
Jul 21, 2021
Sold by
Rogers Jesse
Bought by
Rogers Melea
Current Estimated Value
Purchase Details
Closed on
Aug 13, 2002
Sold by
Bybee R Zack and Bybee Jodie
Bought by
Rogers Jesse
Home Financials for this Owner
Home Financials are based on the most recent Mortgage that was taken out on this home.
Original Mortgage
$184,500
Outstanding Balance
$77,848
Interest Rate
6.51%
Mortgage Type
Seller Take Back
Estimated Equity
$612,637
Purchase Details
Closed on
Apr 24, 1997
Sold by
Kdr Llc
Bought by
Bybee R Zack
Home Financials for this Owner
Home Financials are based on the most recent Mortgage that was taken out on this home.
Original Mortgage
$149,500
Interest Rate
7.86%
Mortgage Type
Purchase Money Mortgage
Create a Home Valuation Report for This Property
The Home Valuation Report is an in-depth analysis detailing your home's value as well as a comparison with similar homes in the area
Home Values in the Area
Average Home Value in this Area
Purchase History
| Date | Buyer | Sale Price | Title Company |
|---|---|---|---|
| Rogers Melea | -- | None Available | |
| Rogers Jesse | -- | Mountain View Title | |
| Bybee R Zack | -- | Cardon Land Title |
Source: Public Records
Mortgage History
| Date | Status | Borrower | Loan Amount |
|---|---|---|---|
| Open | Rogers Jesse | $184,500 | |
| Previous Owner | Bybee R Zack | $149,500 |
Source: Public Records
Tax History Compared to Growth
Tax History
| Year | Tax Paid | Tax Assessment Tax Assessment Total Assessment is a certain percentage of the fair market value that is determined by local assessors to be the total taxable value of land and additions on the property. | Land | Improvement |
|---|---|---|---|---|
| 2025 | $4,805 | $725,209 | $224,652 | $500,557 |
| 2024 | $4,574 | $392,149 | $123,558 | $268,591 |
| 2023 | $4,738 | $413,050 | $123,559 | $289,491 |
| 2022 | $4,803 | $431,200 | $123,559 | $307,641 |
| 2021 | $3,737 | $548,000 | $109,417 | $438,583 |
| 2020 | $3,353 | $455,000 | $99,613 | $355,387 |
| 2019 | $3,395 | $446,000 | $79,802 | $366,198 |
| 2018 | $3,164 | $402,000 | $79,802 | $322,198 |
| 2017 | $2,912 | $357,981 | $74,919 | $283,062 |
| 2016 | $2,695 | $180,793 | $40,468 | $140,325 |
| 2015 | $2,618 | $174,111 | $40,468 | $133,643 |
| 2014 | $2,416 | $157,699 | $40,468 | $117,231 |
Source: Public Records
Map
Nearby Homes