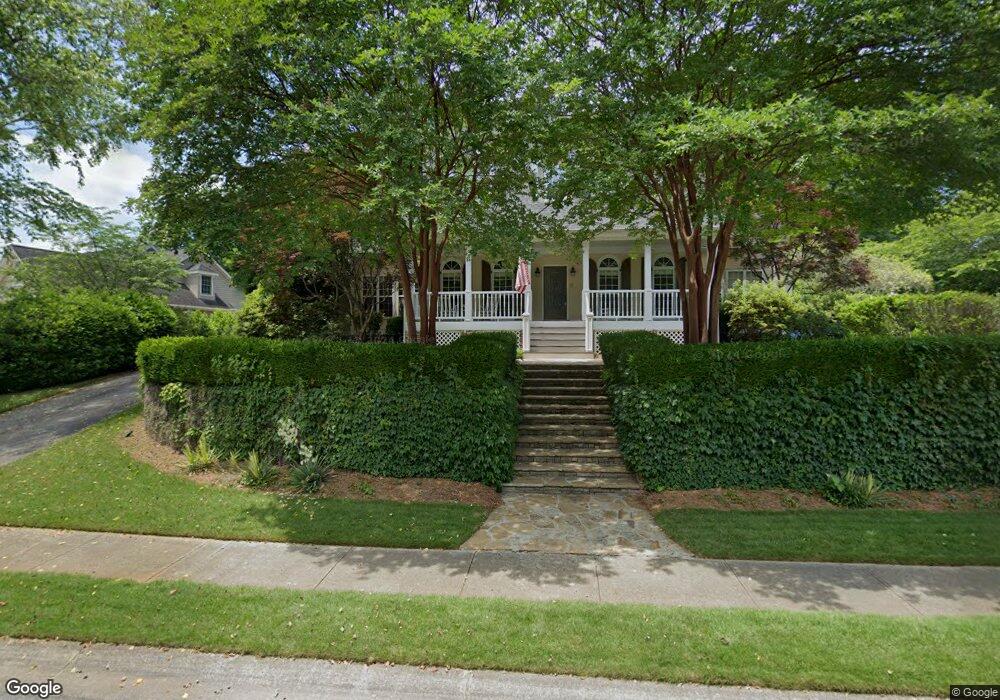
4486 Cavallon Way NW Acworth, GA 30101
Estimated Value: $643,000 - $659,000
4
Beds
4
Baths
3,580
Sq Ft
$182/Sq Ft
Est. Value
About This Home
This home is located at 4486 Cavallon Way NW, Acworth, GA 30101 and is currently estimated at $652,347, approximately $182 per square foot. 4486 Cavallon Way NW is a home located in Cobb County with nearby schools including Frey Elementary School, Durham Middle School, and Allatoona High School.
Ownership History
Date
Name
Owned For
Owner Type
Purchase Details
Closed on
Sep 13, 2007
Sold by
Schisler Mark D
Bought by
Schisler Laura D J
Current Estimated Value
Purchase Details
Closed on
Nov 12, 1999
Sold by
Jumper Geoffrey W and Jumper Sevim E
Bought by
Schisler Mark D and Schisler Deas J
Home Financials for this Owner
Home Financials are based on the most recent Mortgage that was taken out on this home.
Original Mortgage
$247,500
Interest Rate
7.99%
Mortgage Type
New Conventional
Purchase Details
Closed on
Oct 6, 1997
Sold by
White House Builders Inc
Bought by
Jumper Geoffrey W and Jumper Sevim E
Home Financials for this Owner
Home Financials are based on the most recent Mortgage that was taken out on this home.
Original Mortgage
$192,500
Interest Rate
7.55%
Mortgage Type
New Conventional
Purchase Details
Closed on
May 10, 1996
Sold by
Old Stilesboro Cavallon Gp
Bought by
White House Bldrs Inc
Create a Home Valuation Report for This Property
The Home Valuation Report is an in-depth analysis detailing your home's value as well as a comparison with similar homes in the area
Home Values in the Area
Average Home Value in this Area
Purchase History
| Date | Buyer | Sale Price | Title Company |
|---|---|---|---|
| Schisler Laura D J | -- | -- | |
| Schisler Mark D | $275,000 | -- | |
| Jumper Geoffrey W | $257,500 | -- | |
| White House Bldrs Inc | $39,000 | -- |
Source: Public Records
Mortgage History
| Date | Status | Borrower | Loan Amount |
|---|---|---|---|
| Previous Owner | Schisler Mark D | $247,500 | |
| Previous Owner | Jumper Geoffrey W | $192,500 | |
| Closed | White House Bldrs Inc | $0 |
Source: Public Records
Tax History Compared to Growth
Tax History
| Year | Tax Paid | Tax Assessment Tax Assessment Total Assessment is a certain percentage of the fair market value that is determined by local assessors to be the total taxable value of land and additions on the property. | Land | Improvement |
|---|---|---|---|---|
| 2024 | $6,712 | $278,360 | $58,000 | $220,360 |
| 2023 | $5,072 | $227,752 | $24,000 | $203,752 |
| 2022 | $5,658 | $227,752 | $24,000 | $203,752 |
| 2021 | $4,549 | $177,120 | $24,000 | $153,120 |
| 2020 | $4,549 | $177,120 | $24,000 | $153,120 |
| 2019 | $4,549 | $177,120 | $24,000 | $153,120 |
| 2018 | $4,095 | $156,360 | $21,600 | $134,760 |
| 2017 | $3,938 | $156,360 | $21,600 | $134,760 |
| 2016 | $3,943 | $156,360 | $21,600 | $134,760 |
| 2015 | $3,521 | $133,648 | $21,600 | $112,048 |
| 2014 | $3,548 | $133,648 | $0 | $0 |
Source: Public Records
Map
Nearby Homes
- 4525 Cavallon Way NW
- 4544 Cavallon Way NW
- 4467 Sterling Pointe Dr NW
- 2295 Inverwood Dr NW
- 2108 Walnut Creek Trail NW
- 4547 Meadow Green Ln NW
- 4902 Pleasantry Way NW
- 2408 Red Fox Run NW
- 5046 Sunbrook Dr NW
- 4790 Galloways Farm Ln NW
- 5087 Dillingham Dr NW
- 5105 Dillingham Dr NW
- 4980 Newpark Ln NW Unit 2
- 4973 Newpark Ln NW
- 4980 Pleasantry Way NW
- 4463 Brown Deer Ln NW
- 0 Mars Hill Rd Unit 7657672
- 4490 Cavallon Way NW
- 4703 Cavallon Dr NW
- 4707 Cavallon Dr NW
- 4485 Cavallon Way NW
- 4489 Cavallon Way NW
- 4481 Cavallon Way NW
- 4494 Cavallon Way NW
- 4494 Cavallon Way NW
- 2110 Cavallon Ct NW
- 4493 Cavallon Way NW
- 4477 Cavallon Way NW
- 2102 Cavallon Ct NW
- 4498 Cavallon Way NW Unit 41
- 4498 Cavallon Way NW Unit 186
- 4498 Cavallon Way NW
- 4702 Cavallon Dr NW
- 0 Cavallon Ct Unit 7290229
- 4710 Cavallon Dr NW
- 0 Cavallon Dr NW Unit 8567969
- 0 Cavallon Dr NW Unit 9027690