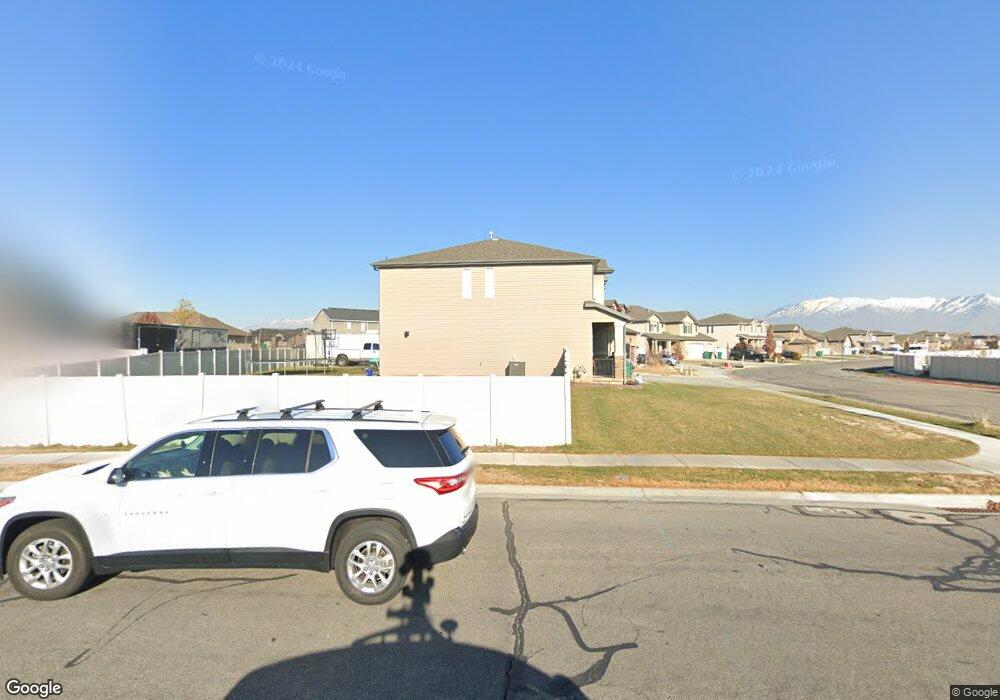
4486 W 5850 S Hooper, UT 84315
Estimated Value: $558,369 - $618,000
4
Beds
3
Baths
2,458
Sq Ft
$240/Sq Ft
Est. Value
About This Home
This home is located at 4486 W 5850 S, Hooper, UT 84315 and is currently estimated at $589,342, approximately $239 per square foot. 4486 W 5850 S is a home located in Weber County with nearby schools including Freedom School, Roy Junior High School, and Roy High School.
Ownership History
Date
Name
Owned For
Owner Type
Purchase Details
Closed on
Jun 20, 2013
Sold by
Olsen Gregory S and Olsen Krystal K
Bought by
Olsen Gregory S and Olsen Krystal K
Current Estimated Value
Home Financials for this Owner
Home Financials are based on the most recent Mortgage that was taken out on this home.
Original Mortgage
$264,499
Outstanding Balance
$188,233
Interest Rate
3.5%
Mortgage Type
FHA
Estimated Equity
$401,109
Purchase Details
Closed on
Feb 24, 2009
Sold by
Olsen Greg and Olsen Krystal
Bought by
Olsen Gregory S and Olsen Krystal K
Home Financials for this Owner
Home Financials are based on the most recent Mortgage that was taken out on this home.
Original Mortgage
$266,483
Interest Rate
4.91%
Mortgage Type
FHA
Purchase Details
Closed on
Aug 21, 2006
Sold by
Woodside Wildwood Llc
Bought by
Olsen Greg and Olsen Krystal
Home Financials for this Owner
Home Financials are based on the most recent Mortgage that was taken out on this home.
Original Mortgage
$51,400
Interest Rate
6.33%
Mortgage Type
Stand Alone Second
Create a Home Valuation Report for This Property
The Home Valuation Report is an in-depth analysis detailing your home's value as well as a comparison with similar homes in the area
Home Values in the Area
Average Home Value in this Area
Purchase History
| Date | Buyer | Sale Price | Title Company |
|---|---|---|---|
| Olsen Gregory S | -- | Magellan Title | |
| Olsen Gregory S | -- | Lincoln Title Insurance Agen | |
| Olsen Greg | -- | U S Title Of Utah Ogden |
Source: Public Records
Mortgage History
| Date | Status | Borrower | Loan Amount |
|---|---|---|---|
| Open | Olsen Gregory S | $264,499 | |
| Closed | Olsen Gregory S | $266,483 | |
| Closed | Olsen Greg | $51,400 | |
| Closed | Olsen Greg | $205,600 |
Source: Public Records
Tax History Compared to Growth
Tax History
| Year | Tax Paid | Tax Assessment Tax Assessment Total Assessment is a certain percentage of the fair market value that is determined by local assessors to be the total taxable value of land and additions on the property. | Land | Improvement |
|---|---|---|---|---|
| 2025 | $3,329 | $530,961 | $200,052 | $330,909 |
| 2024 | $3,365 | $301,399 | $110,028 | $191,371 |
| 2023 | $3,259 | $289,300 | $109,606 | $179,694 |
| 2022 | $3,383 | $310,200 | $84,773 | $225,427 |
| 2021 | $2,871 | $441,000 | $108,815 | $332,185 |
| 2020 | $2,715 | $383,000 | $103,792 | $279,208 |
| 2019 | $2,644 | $352,000 | $102,513 | $249,487 |
| 2018 | $2,487 | $315,000 | $67,355 | $247,645 |
| 2017 | $2,351 | $287,000 | $66,842 | $220,158 |
| 2016 | $2,218 | $145,576 | $36,485 | $109,091 |
| 2015 | $2,133 | $137,581 | $33,685 | $103,896 |
| 2014 | $1,922 | $119,419 | $28,282 | $91,137 |
Source: Public Records
Map
Nearby Homes