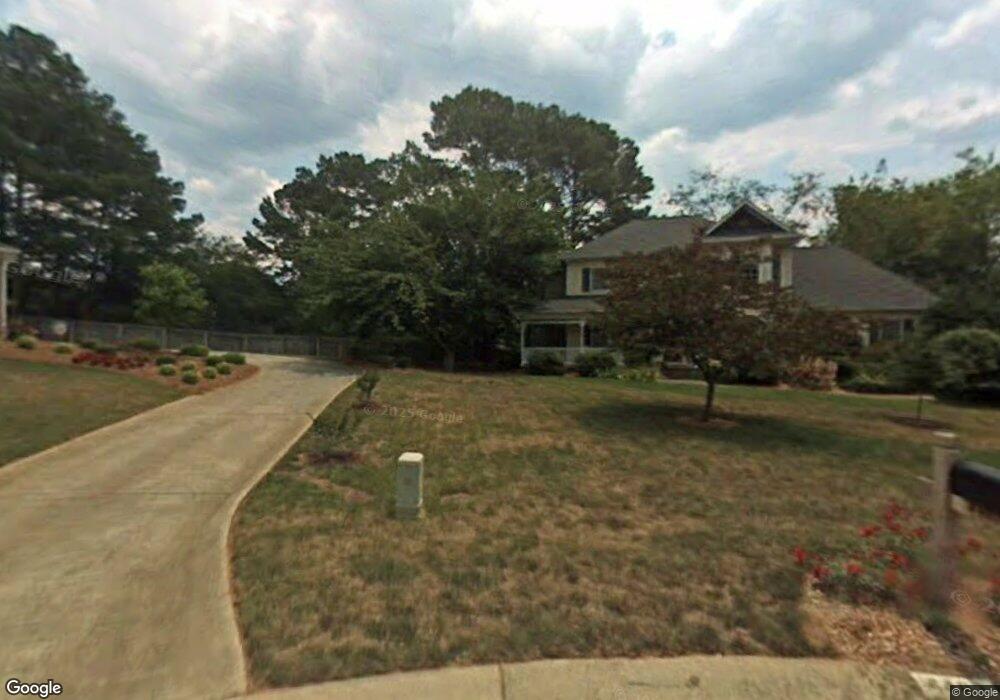
4487 Cardiff Ct NE Unit 2 Roswell, GA 30075
East Cobb NeighborhoodEstimated Value: $651,000 - $711,837
4
Beds
4
Baths
2,589
Sq Ft
$264/Sq Ft
Est. Value
About This Home
This home is located at 4487 Cardiff Ct NE Unit 2, Roswell, GA 30075 and is currently estimated at $682,709, approximately $263 per square foot. 4487 Cardiff Ct NE Unit 2 is a home located in Cobb County with nearby schools including Garrison Mill Elementary School, Mabry Middle School, and Lassiter High School.
Ownership History
Date
Name
Owned For
Owner Type
Purchase Details
Closed on
Apr 7, 2000
Sold by
Toriello Peter T and Toriello Mary M
Bought by
Richardson Matthew D
Current Estimated Value
Home Financials for this Owner
Home Financials are based on the most recent Mortgage that was taken out on this home.
Original Mortgage
$183,000
Outstanding Balance
$61,797
Interest Rate
8.24%
Mortgage Type
New Conventional
Estimated Equity
$620,912
Purchase Details
Closed on
Sep 20, 1996
Sold by
Norman Michael L Katherine
Bought by
Toriello Peter T Mary M
Purchase Details
Closed on
Mar 24, 1995
Sold by
Brower David A Theresa C
Bought by
Norman Michael L Katherin
Create a Home Valuation Report for This Property
The Home Valuation Report is an in-depth analysis detailing your home's value as well as a comparison with similar homes in the area
Home Values in the Area
Average Home Value in this Area
Purchase History
| Date | Buyer | Sale Price | Title Company |
|---|---|---|---|
| Richardson Matthew D | $228,800 | -- | |
| Toriello Peter T Mary M | $205,000 | -- | |
| Norman Michael L Katherin | $185,000 | -- |
Source: Public Records
Mortgage History
| Date | Status | Borrower | Loan Amount |
|---|---|---|---|
| Open | Richardson Matthew D | $183,000 | |
| Closed | Norman Michael L Katherin | $0 |
Source: Public Records
Tax History Compared to Growth
Tax History
| Year | Tax Paid | Tax Assessment Tax Assessment Total Assessment is a certain percentage of the fair market value that is determined by local assessors to be the total taxable value of land and additions on the property. | Land | Improvement |
|---|---|---|---|---|
| 2025 | $1,425 | $239,508 | $52,000 | $187,508 |
| 2024 | $5,721 | $239,508 | $52,000 | $187,508 |
| 2023 | $5,179 | $239,508 | $52,000 | $187,508 |
| 2022 | $4,509 | $182,020 | $44,000 | $138,020 |
| 2021 | $4,318 | $173,276 | $44,000 | $129,276 |
| 2020 | $4,318 | $173,276 | $44,000 | $129,276 |
| 2019 | $4,529 | $182,952 | $40,000 | $142,952 |
| 2018 | $4,529 | $182,952 | $40,000 | $142,952 |
| 2017 | $3,704 | $151,128 | $32,000 | $119,128 |
| 2016 | $3,711 | $151,128 | $32,000 | $119,128 |
| 2015 | $3,351 | $131,588 | $42,000 | $89,588 |
| 2014 | $3,374 | $131,588 | $0 | $0 |
Source: Public Records
Map
Nearby Homes
- 4361 Old Mabry Ln NE
- 4363 Old Mabry Rd NE
- 4274 Loch Highland Pkwy NE
- 4209 Loch Highland Pkwy NE
- 4579 Glenforest Dr NE
- 3985 Loch Highland Pass NE
- 4300 Inverness Ct NE Unit 1
- 11395 West Rd
- 11675 Highland Colony Dr Unit 1
- 4019 Wesley Chapel Rd
- 4765 Catoosa Trail NE Unit 2
- 4032 Wesley Chapel Rd
- 4022 Wesley Chapel Rd
- 3870 Sweat Creek Run
- 4673 Jefferson Township Place
- 3990 Wesley Chapel Rd
- 11180 West Rd
- 11140 West Rd
- 11790 Highland Colony Dr
- 4486 Cardiff Ct NE
- 4489 Cardiff Ct NE Unit 2
- 4179 Riverhill Ct NE
- 4305 Rocky Glen NE
- 4181 Riverhill Ct NE
- 4307 Rocky Glen NE
- 0 Rocky Glen NE
- 4303 Rocky Glen NE
- 4488 Cardiff Ct NE
- 4493 Cardiff Ct NE
- 4183 Riverhill Ct NE
- 4490 Cardiff Ct NE
- 4304 Rocky Glen NE
- 4301 Rocky Glen NE
- 4495 Cardiff Ct NE
- 4180 Riverhill Ct NE
- 4330 Riverhill Ln NE
- 4182 Riverhill Ct NE
- 4185 Riverhill Ct NE
- 4175 Riverhill Ct NE