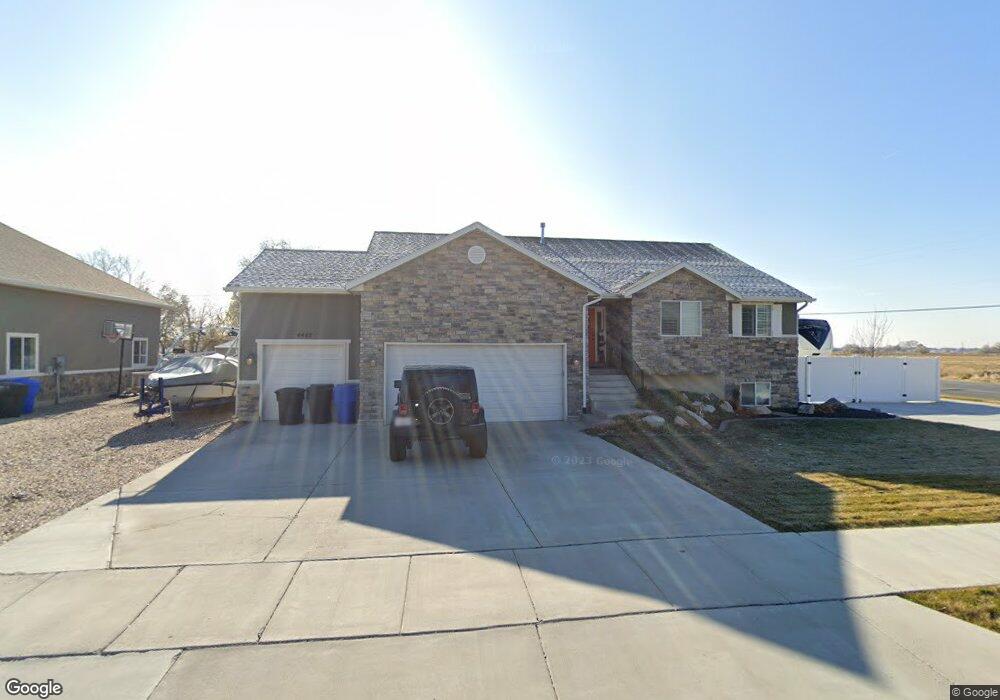
4487 W 1500 N West Point, UT 84015
Estimated Value: $591,000 - $708,000
3
Beds
2
Baths
3,221
Sq Ft
$201/Sq Ft
Est. Value
About This Home
This home is located at 4487 W 1500 N, West Point, UT 84015 and is currently estimated at $648,001, approximately $201 per square foot. 4487 W 1500 N is a home located in Davis County with nearby schools including West Point School, West Point Junior High School, and Syracuse High School.
Ownership History
Date
Name
Owned For
Owner Type
Purchase Details
Closed on
Sep 9, 2019
Sold by
Heinbach Brent and Heinbach Shaunna
Bought by
Heinbach Brent Andrew and Heinbach Shaunna
Current Estimated Value
Home Financials for this Owner
Home Financials are based on the most recent Mortgage that was taken out on this home.
Original Mortgage
$332,000
Outstanding Balance
$290,771
Interest Rate
3.7%
Mortgage Type
New Conventional
Estimated Equity
$357,230
Purchase Details
Closed on
Oct 20, 2016
Sold by
Scheaffer Mindi and Scheaffer Brett
Bought by
Heinbach Brent and Heinbach Shaunna
Purchase Details
Closed on
Feb 13, 2015
Sold by
Toucan Investment Real Estate & Developm
Bought by
Scheaffer Mindi and Scheaffer Brett
Purchase Details
Closed on
Aug 15, 2014
Sold by
Dorius Val E and Mathews Paul T
Bought by
Toucan Investment Real Estate And Develo
Create a Home Valuation Report for This Property
The Home Valuation Report is an in-depth analysis detailing your home's value as well as a comparison with similar homes in the area
Home Values in the Area
Average Home Value in this Area
Purchase History
| Date | Buyer | Sale Price | Title Company |
|---|---|---|---|
| Heinbach Brent Andrew | -- | Stewart Title Ins Agen | |
| Heinbach Brent | -- | Us Title | |
| Scheaffer Mindi | -- | Mountain View Title & | |
| Scheaffer Mindi | -- | Mountain View Title & Esc | |
| Toucan Investment Real Estate & Developm | -- | Mountain View Title & Escr | |
| Toucan Investment Real Estate And Develo | -- | Mountain View Title |
Source: Public Records
Mortgage History
| Date | Status | Borrower | Loan Amount |
|---|---|---|---|
| Open | Heinbach Brent Andrew | $332,000 |
Source: Public Records
Tax History Compared to Growth
Tax History
| Year | Tax Paid | Tax Assessment Tax Assessment Total Assessment is a certain percentage of the fair market value that is determined by local assessors to be the total taxable value of land and additions on the property. | Land | Improvement |
|---|---|---|---|---|
| 2025 | $3,154 | $302,500 | $107,052 | $195,448 |
| 2024 | $3,154 | $291,500 | $96,379 | $195,121 |
| 2023 | $3,137 | $533,000 | $120,061 | $412,939 |
| 2022 | $3,340 | $310,751 | $62,431 | $248,320 |
| 2021 | $2,940 | $409,000 | $97,626 | $311,374 |
| 2020 | $2,584 | $354,000 | $82,000 | $272,000 |
| 2019 | $2,423 | $327,000 | $79,560 | $247,440 |
| 2018 | $2,423 | $322,000 | $79,595 | $242,405 |
| 2016 | $2,014 | $140,415 | $30,796 | $109,619 |
| 2015 | $2,198 | $145,200 | $30,796 | $114,404 |
| 2014 | $1,185 | $79,196 | $30,796 | $48,400 |
| 2013 | -- | $48,141 | $48,141 | $0 |
Source: Public Records
Map
Nearby Homes
- 1635 N 4625 W
- 4302 W 1550 N
- 1717 N 4325 W
- 4061 W 1250 N Unit 1250
- 1124 N 4150 W
- 2084 N 4500 W
- 4469 W 1000 N Unit 120
- 3932 W 825 N Unit WF5
- 3918 W 825 N Unit WF6
- 4719 W 650 N
- 4171 W 2425 N
- 477 N 4500 W
- 3784 W 2300 N
- 3762 W 2300 N
- Torino Farmhouse Plan at Cranefield Estates
- 1700 Farmhouse Plan at Cranefield Estates - Estates Collection
- 2000 Traditional Plan at Cranefield Estates - Estates Collection
- Murano Traditional Plan at Cranefield Estates - Estates Collection
- 2400 Farmhouse Plan at Cranefield Estates - Estates Collection
- 1825 Traditional Plan at Cranefield Estates - Estates Collection