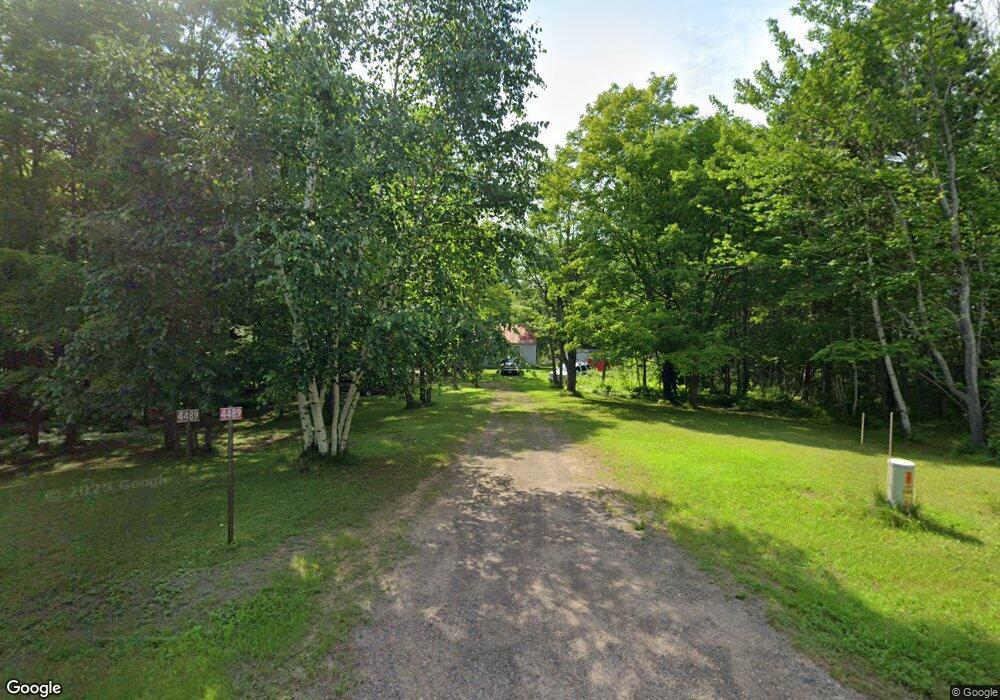
4489 Solway Rd Duluth, MN 55810
Estimated Value: $224,237 - $399,000
3
Beds
1
Bath
1,008
Sq Ft
$318/Sq Ft
Est. Value
About This Home
This home is located at 4489 Solway Rd, Duluth, MN 55810 and is currently estimated at $320,079, approximately $317 per square foot. 4489 Solway Rd is a home located in St. Louis County with nearby schools including Pike Lake Elementary School, Jedlicka Middle School, and Proctor Senior High School.
Ownership History
Date
Name
Owned For
Owner Type
Purchase Details
Closed on
Jun 8, 2007
Sold by
Schilling Theodore H and Schilling Muriel J
Bought by
Schilling Jaime and Schilling Holly
Current Estimated Value
Home Financials for this Owner
Home Financials are based on the most recent Mortgage that was taken out on this home.
Original Mortgage
$245,000
Interest Rate
6.37%
Mortgage Type
Unknown
Purchase Details
Closed on
Oct 5, 2006
Sold by
Schilling Ted and Schilling Muriel
Bought by
Schilling Jaime and Schilling Holly
Create a Home Valuation Report for This Property
The Home Valuation Report is an in-depth analysis detailing your home's value as well as a comparison with similar homes in the area
Purchase History
| Date | Buyer | Sale Price | Title Company |
|---|---|---|---|
| Schilling Jaime | -- | Lakeview Title | |
| Schilling Jaime | $18,000 | None Available |
Source: Public Records
Mortgage History
| Date | Status | Borrower | Loan Amount |
|---|---|---|---|
| Closed | Schilling Jaime | $245,000 |
Source: Public Records
Tax History
| Year | Tax Paid | Tax Assessment Tax Assessment Total Assessment is a certain percentage of the fair market value that is determined by local assessors to be the total taxable value of land and additions on the property. | Land | Improvement |
|---|---|---|---|---|
| 2024 | $1,332 | $159,400 | $89,000 | $70,400 |
| 2023 | $1,332 | $136,900 | $76,400 | $60,500 |
| 2022 | $1,060 | $115,400 | $58,100 | $57,300 |
| 2021 | $1,054 | $107,500 | $55,700 | $51,800 |
| 2020 | $1,074 | $107,500 | $55,700 | $51,800 |
| 2019 | $718 | $107,500 | $55,700 | $51,800 |
| 2018 | $760 | $83,700 | $45,500 | $38,200 |
| 2017 | $716 | $83,500 | $48,000 | $35,500 |
| 2016 | $684 | $80,200 | $46,400 | $33,800 |
| 2015 | $674 | $52,300 | $32,700 | $19,600 |
| 2014 | $674 | $55,300 | $40,800 | $14,500 |
Source: Public Records
Map
Nearby Homes
- 4344 Midway Rd
- 5xxx Highway 194
- 57xx Rose Rd
- 5980 Old Miller Trunk Hwy
- 4215 Midway Rd
- 5781 S Pike Lake Rd
- 5756 Maple Grove Rd
- 51xx Lindahl Rd
- 3970 Old Midway Rd
- 3958 Midway Rd
- 3920 Old Midway Rd
- 5469 Martin Rd
- 52XX W Arrowhead Rd
- 45xx Unit Lot B1 Norway Pine
- 4320 Thielke Cir
- 45xx - Lot B1 Norway Pines Place
- 45xx - Lot B2 Norway Pines Place
- 5224 Falcon Dr
- 47xx Miller Trunk Hwy
- 44XX Ugstad Rd
Your Personal Tour Guide
Ask me questions while you tour the home.