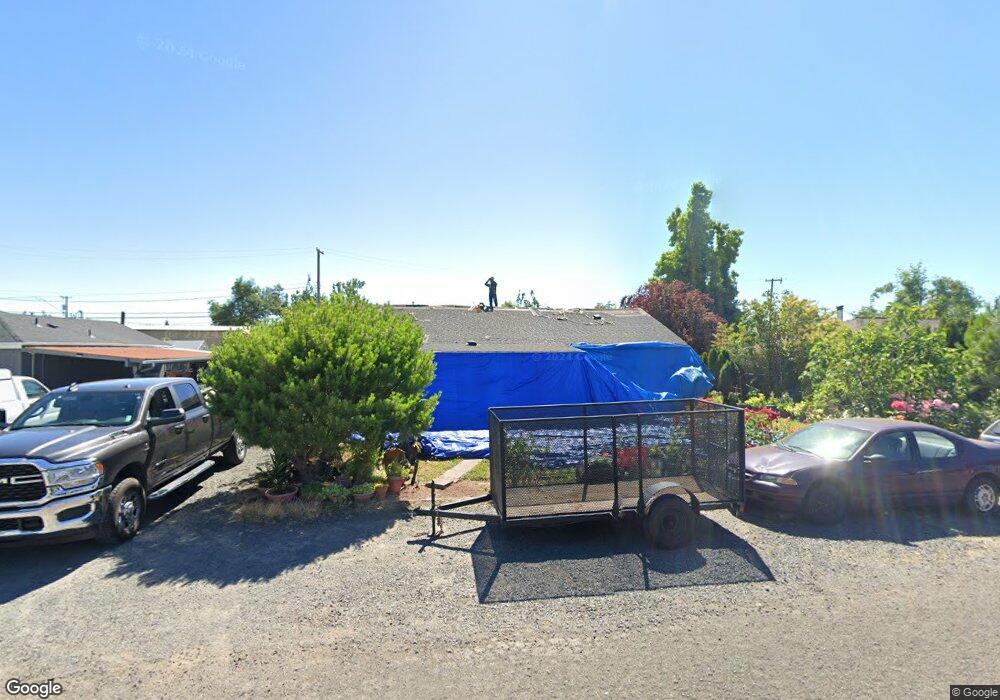
449 33rd St Springfield, OR 97478
East Springfield NeighborhoodEstimated Value: $302,000 - $361,000
3
Beds
1
Bath
1,325
Sq Ft
$252/Sq Ft
Est. Value
About This Home
This home is located at 449 33rd St, Springfield, OR 97478 and is currently estimated at $333,444, approximately $251 per square foot. 449 33rd St is a home located in Lane County with nearby schools including Riverbend Elementary School, Briggs Middle School, and Thurston High School.
Ownership History
Date
Name
Owned For
Owner Type
Purchase Details
Closed on
Jan 13, 2020
Sold by
Cacho Adolfo Sanchez
Bought by
Cacho Adolfo Sanchez and Sanchez Maria
Current Estimated Value
Home Financials for this Owner
Home Financials are based on the most recent Mortgage that was taken out on this home.
Original Mortgage
$161,000
Outstanding Balance
$141,945
Interest Rate
3.6%
Mortgage Type
New Conventional
Estimated Equity
$191,499
Purchase Details
Closed on
May 19, 2006
Sold by
Sogn Douglas A
Bought by
Cacho Adolfo Sanchez
Home Financials for this Owner
Home Financials are based on the most recent Mortgage that was taken out on this home.
Original Mortgage
$35,560
Interest Rate
6.41%
Mortgage Type
Stand Alone Second
Purchase Details
Closed on
Sep 15, 2005
Sold by
Johnson Alvin L and Johnson Dorothy Mae
Bought by
Sogn Douglas A
Create a Home Valuation Report for This Property
The Home Valuation Report is an in-depth analysis detailing your home's value as well as a comparison with similar homes in the area
Home Values in the Area
Average Home Value in this Area
Purchase History
| Date | Buyer | Sale Price | Title Company |
|---|---|---|---|
| Cacho Adolfo Sanchez | -- | Western Title & Escrow | |
| Cacho Adolfo Sanchez | $177,800 | Western Title & Escrow Compa | |
| Sogn Douglas A | $99,000 | Fidelity Natl Title Co Of Or |
Source: Public Records
Mortgage History
| Date | Status | Borrower | Loan Amount |
|---|---|---|---|
| Open | Cacho Adolfo Sanchez | $161,000 | |
| Closed | Cacho Adolfo Sanchez | $35,560 | |
| Closed | Cacho Adolfo Sanchez | $142,240 |
Source: Public Records
Tax History
| Year | Tax Paid | Tax Assessment Tax Assessment Total Assessment is a certain percentage of the fair market value that is determined by local assessors to be the total taxable value of land and additions on the property. | Land | Improvement |
|---|---|---|---|---|
| 2025 | $2,531 | $138,041 | -- | -- |
| 2024 | $2,490 | $134,021 | -- | -- |
| 2023 | $2,490 | $130,118 | $0 | $0 |
| 2022 | $2,306 | $126,329 | $0 | $0 |
| 2021 | $2,265 | $122,650 | $0 | $0 |
| 2020 | $2,199 | $119,078 | $0 | $0 |
| 2019 | $2,133 | $115,610 | $0 | $0 |
| 2018 | $2,011 | $108,974 | $0 | $0 |
| 2017 | $1,933 | $108,974 | $0 | $0 |
| 2016 | $1,893 | $105,800 | $0 | $0 |
| 2015 | $1,839 | $102,718 | $0 | $0 |
| 2014 | $1,811 | $99,726 | $0 | $0 |
Source: Public Records
Map
Nearby Homes
Your Personal Tour Guide
Ask me questions while you tour the home.