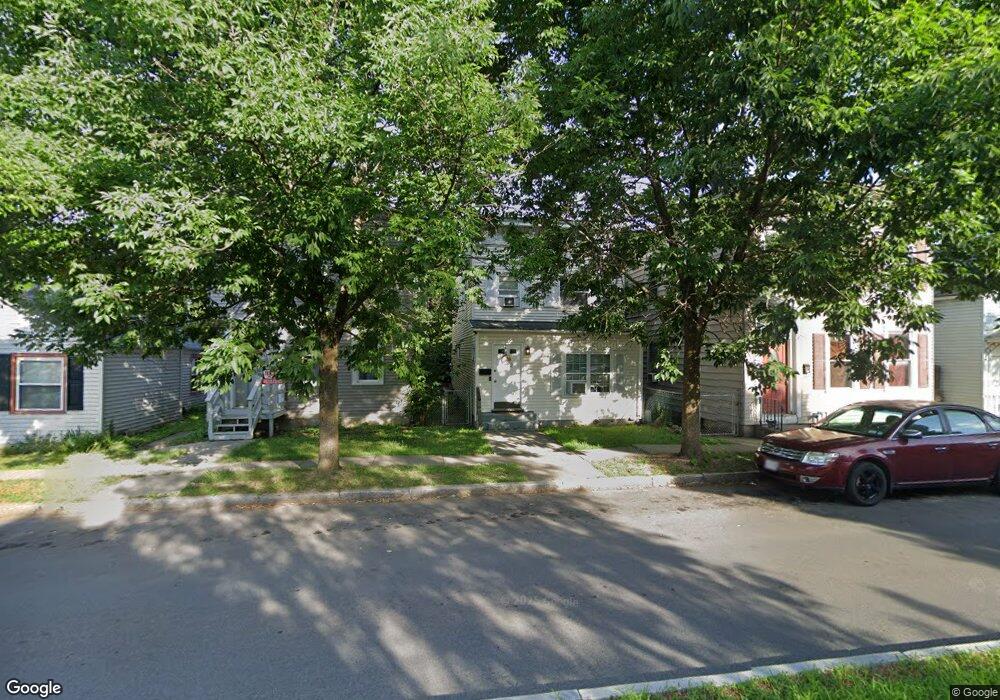
449 6th Ave Troy, NY 12182
Lansingburgh NeighborhoodEstimated Value: $197,854 - $213,000
3
Beds
1
Bath
1,680
Sq Ft
$123/Sq Ft
Est. Value
About This Home
This home is located at 449 6th Ave, Troy, NY 12182 and is currently estimated at $206,964, approximately $123 per square foot. 449 6th Ave is a home located in Rensselaer County with nearby schools including Turnpike Elementary School, Rensselaer Park Elementary School, and Knickerbacker Middle School.
Ownership History
Date
Name
Owned For
Owner Type
Purchase Details
Closed on
Nov 10, 2022
Sold by
Bullard Tiffanie
Bought by
Morrissey Caleb
Current Estimated Value
Home Financials for this Owner
Home Financials are based on the most recent Mortgage that was taken out on this home.
Original Mortgage
$151,050
Outstanding Balance
$144,548
Interest Rate
5.1%
Mortgage Type
Purchase Money Mortgage
Estimated Equity
$62,416
Purchase Details
Closed on
Nov 28, 2018
Sold by
449 6Th Avenue Land T
Bought by
Bullard Tiffanie M
Purchase Details
Closed on
May 11, 2015
Sold by
Rpsny Llc As Trustee
Bought by
Managements Metuchen
Purchase Details
Closed on
Apr 18, 2010
Sold by
Mcmeel Paul J
Bought by
Rpsny Llc
Purchase Details
Closed on
Apr 10, 2010
Sold by
Mcmeel Paul J
Bought by
Rpsny Llc
Create a Home Valuation Report for This Property
The Home Valuation Report is an in-depth analysis detailing your home's value as well as a comparison with similar homes in the area
Home Values in the Area
Average Home Value in this Area
Purchase History
| Date | Buyer | Sale Price | Title Company |
|---|---|---|---|
| Morrissey Caleb | $159,000 | None Available | |
| Bullard Tiffanie M | $30,000 | -- | |
| Managements Metuchen | -- | Madeline Sheila Galvin | |
| Rpsny Llc | $45,000 | -- | |
| Rpsny Llc | $45,000 | -- |
Source: Public Records
Mortgage History
| Date | Status | Borrower | Loan Amount |
|---|---|---|---|
| Open | Morrissey Caleb | $151,050 |
Source: Public Records
Tax History
| Year | Tax Paid | Tax Assessment Tax Assessment Total Assessment is a certain percentage of the fair market value that is determined by local assessors to be the total taxable value of land and additions on the property. | Land | Improvement |
|---|---|---|---|---|
| 2024 | $5,061 | $104,000 | $8,800 | $95,200 |
| 2023 | $4,660 | $104,000 | $8,800 | $95,200 |
| 2022 | $3,707 | $85,000 | $8,800 | $76,200 |
| 2021 | $968 | $85,000 | $8,800 | $76,200 |
| 2020 | $1,752 | $85,000 | $8,800 | $76,200 |
| 2019 | $2,638 | $85,000 | $8,800 | $76,200 |
| 2018 | $2,638 | $85,000 | $8,800 | $76,200 |
| 2017 | $2,603 | $85,000 | $8,800 | $76,200 |
| 2016 | $3,884 | $85,000 | $8,800 | $76,200 |
| 2015 | -- | $85,000 | $8,800 | $76,200 |
| 2014 | -- | $85,000 | $8,800 | $76,200 |
Source: Public Records
Map
Nearby Homes
Your Personal Tour Guide
Ask me questions while you tour the home.