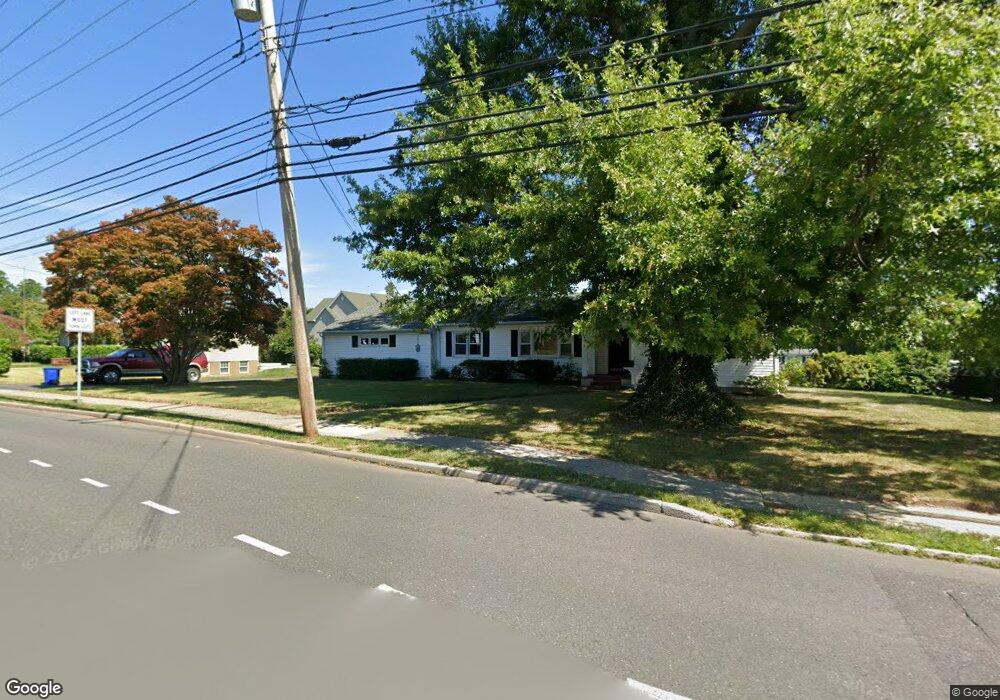
449 Branchport Ave Oceanport, NJ 07757
Estimated Value: $580,000 - $797,000
2
Beds
2
Baths
1,280
Sq Ft
$563/Sq Ft
Est. Value
About This Home
This home is located at 449 Branchport Ave, Oceanport, NJ 07757 and is currently estimated at $721,135, approximately $563 per square foot. 449 Branchport Ave is a home located in Monmouth County with nearby schools including Wolf Hill Elementary School, Maple Place Elementary and Middle School, and Shore Regional High School.
Ownership History
Date
Name
Owned For
Owner Type
Purchase Details
Closed on
Mar 11, 2014
Sold by
Cook Dorothy E
Bought by
Leavy Thomas and Leavy Kimberly
Current Estimated Value
Home Financials for this Owner
Home Financials are based on the most recent Mortgage that was taken out on this home.
Original Mortgage
$195,000
Outstanding Balance
$53,627
Interest Rate
3%
Mortgage Type
Purchase Money Mortgage
Estimated Equity
$667,508
Create a Home Valuation Report for This Property
The Home Valuation Report is an in-depth analysis detailing your home's value as well as a comparison with similar homes in the area
Home Values in the Area
Average Home Value in this Area
Purchase History
| Date | Buyer | Sale Price | Title Company |
|---|---|---|---|
| Leavy Thomas | $225,000 | Democracy Title Agency |
Source: Public Records
Mortgage History
| Date | Status | Borrower | Loan Amount |
|---|---|---|---|
| Open | Leavy Thomas | $195,000 |
Source: Public Records
Tax History Compared to Growth
Tax History
| Year | Tax Paid | Tax Assessment Tax Assessment Total Assessment is a certain percentage of the fair market value that is determined by local assessors to be the total taxable value of land and additions on the property. | Land | Improvement |
|---|---|---|---|---|
| 2025 | $8,413 | $573,100 | $432,200 | $140,900 |
| 2024 | $8,679 | $532,800 | $398,000 | $134,800 |
| 2023 | $8,679 | $521,600 | $393,500 | $128,100 |
| 2022 | $8,152 | $461,300 | $348,500 | $112,800 |
| 2021 | $8,152 | $428,700 | $321,500 | $107,200 |
| 2020 | $7,213 | $394,600 | $306,200 | $88,400 |
| 2019 | $6,898 | $383,000 | $297,200 | $85,800 |
| 2018 | $6,834 | $382,000 | $297,200 | $84,800 |
| 2017 | $5,485 | $254,300 | $181,600 | $72,700 |
| 2016 | $5,555 | $259,200 | $187,900 | $71,300 |
| 2015 | $5,413 | $261,000 | $187,900 | $73,100 |
| 2014 | $5,851 | $286,100 | $196,900 | $89,200 |
Source: Public Records
Map
Nearby Homes
- 13 Morris Place
- 66 Shrewsbury Ave
- 15 Signal Ave
- 265 Port Au Peck Ave
- 222 Coleman Ave
- 238 Branchport Ave
- 10 Asbury Ave
- 3 Foggia Way
- 572 Jay St
- 565 Joline Ave
- 190 Spruce St Unit 4
- 401 Joline Ave
- 8 Pocahontas Ave
- 631 Irving Place
- 119 Washington St
- 28 Patten Ln
- 211 Rockwell Ave
- 139 Sixth Ave
- 11 Clay St
- 392 Florence Ave
- 451 Branchport Ave
- 441 Branchport Ave
- 312 Port Au Peck Ave
- 7 Vreeland Place
- 448 Branchport Ave
- 450 Branchport Ave
- 442 Branchport Ave
- 439 Branchport Ave
- 8 Vreeland Place
- 305 Port Au Peck Ave
- 435 Branchport Ave
- 7 Centennial Ave
- 6 Centennial Ave
- 311 Port Au Peck Ave
- 320 Port Au Peck Ave
- 438 Branchport Ave
- 21 Vreeland Place
- 14 Vreeland Place
- 292 Port Au Peck Ave
- 299 Port Au Peck Ave