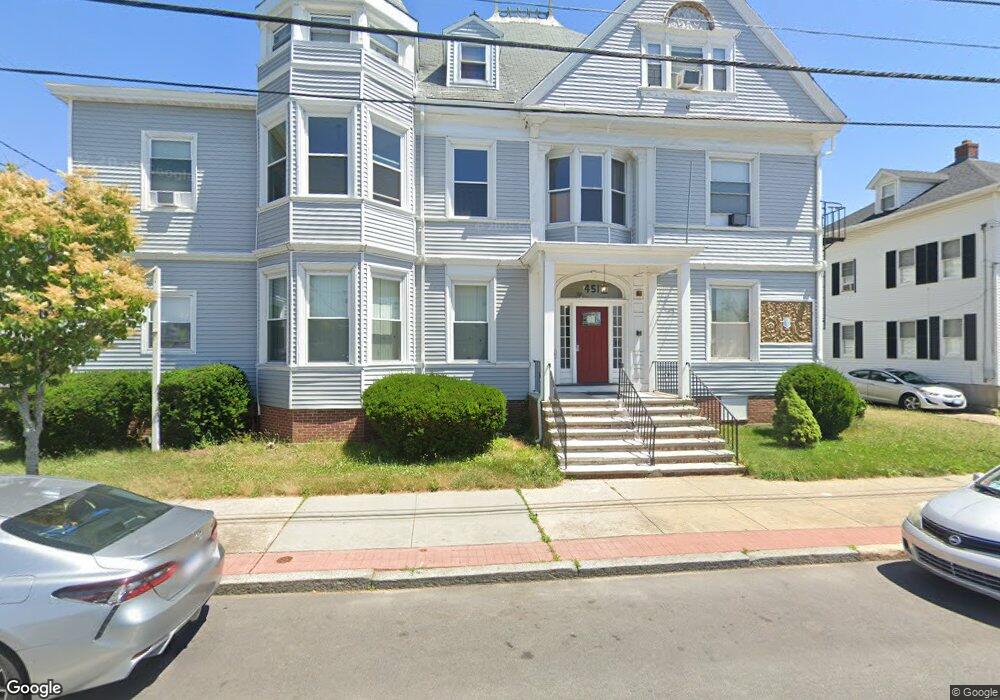
449 Broadway Pawtucket, RI 02860
Pleasant View NeighborhoodEstimated Value: $997,335
12
Beds
9
Baths
14,964
Sq Ft
$67/Sq Ft
Est. Value
About This Home
This home is located at 449 Broadway, Pawtucket, RI 02860 and is currently estimated at $997,335, approximately $66 per square foot. 449 Broadway is a home located in Providence County with nearby schools including St Cecilia School and Saint Raphael Academy.
Ownership History
Date
Name
Owned For
Owner Type
Purchase Details
Closed on
Jun 2, 2016
Sold by
Lawrence Capital Group
Bought by
449 Broadway Llc
Current Estimated Value
Home Financials for this Owner
Home Financials are based on the most recent Mortgage that was taken out on this home.
Original Mortgage
$300,000
Outstanding Balance
$237,625
Interest Rate
3.59%
Mortgage Type
Commercial
Estimated Equity
$759,710
Purchase Details
Closed on
Apr 5, 2012
Sold by
Percy Manuel
Bought by
Lawrence Capital Gr Ll
Purchase Details
Closed on
Mar 20, 2012
Sold by
A J Props
Bought by
Percy Manuel
Purchase Details
Closed on
Jun 22, 2011
Sold by
Percy Manuel
Bought by
Aj Props
Purchase Details
Closed on
May 24, 2011
Sold by
Percy Manuel
Bought by
Aj Props Llc
Create a Home Valuation Report for This Property
The Home Valuation Report is an in-depth analysis detailing your home's value as well as a comparison with similar homes in the area
Home Values in the Area
Average Home Value in this Area
Purchase History
| Date | Buyer | Sale Price | Title Company |
|---|---|---|---|
| 449 Broadway Llc | $400,000 | -- | |
| Lawrence Capital Gr Ll | $500,000 | -- | |
| Percy Manuel | $1,864 | -- | |
| Aj Props | $1,435 | -- | |
| Aj Props Llc | $1,435 | -- |
Source: Public Records
Mortgage History
| Date | Status | Borrower | Loan Amount |
|---|---|---|---|
| Open | 449 Broadway Llc | $300,000 | |
| Previous Owner | Aj Props Llc | $400,000 |
Source: Public Records
Tax History
| Year | Tax Paid | Tax Assessment Tax Assessment Total Assessment is a certain percentage of the fair market value that is determined by local assessors to be the total taxable value of land and additions on the property. | Land | Improvement |
|---|---|---|---|---|
| 2025 | $9,185 | $698,500 | $94,300 | $604,200 |
| 2024 | -- | $698,500 | $94,300 | $604,200 |
| 2023 | $0 | $547,500 | $78,400 | $469,100 |
| 2022 | $0 | $547,500 | $78,400 | $469,100 |
| 2021 | $0 | $547,500 | $78,400 | $469,100 |
| 2020 | $0 | $523,700 | $78,400 | $445,300 |
| 2019 | $12,078 | $523,700 | $78,400 | $445,300 |
| 2018 | $0 | $523,700 | $78,400 | $445,300 |
| 2017 | $0 | $511,000 | $80,400 | $430,600 |
| 2016 | -- | $511,000 | $80,400 | $430,600 |
| 2015 | -- | $511,000 | $80,400 | $430,600 |
| 2014 | -- | $552,400 | $87,400 | $465,000 |
Source: Public Records
Map
Nearby Homes
- 35 Laurel St
- 153 Central Ave
- 54 Sabin St
- 211 Carnation St
- 300 Front St Unit 105
- 300 Front St Unit 409
- 48 Kossuth St
- 133 Cottage St
- 150 N Bend St
- 39 Webster St Unit 204
- 396 Roosevelt Ave
- 511 High St
- 517 High St
- 11 Appleton Ave
- 23 Spring St
- 89 Armistice Blvd
- 256 High St
- 735 Broadway
- 36 Underwood St
- 27 Collins Ave
Your Personal Tour Guide
Ask me questions while you tour the home.