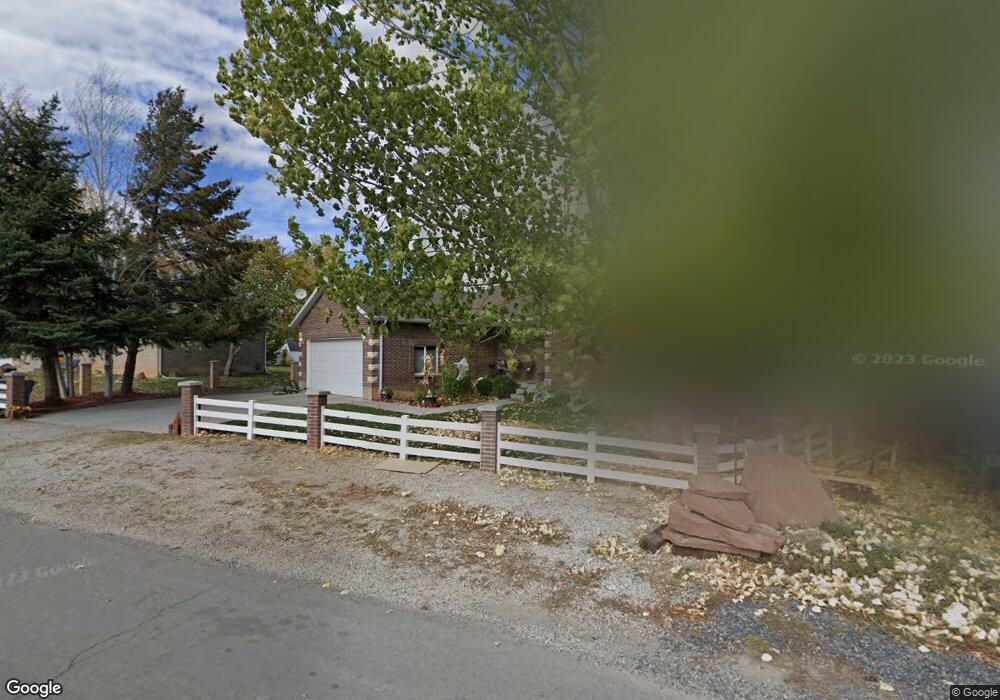
449 E 400 N Santaquin, UT 84655
Estimated Value: $487,000 - $547,000
5
Beds
3
Baths
2,797
Sq Ft
$184/Sq Ft
Est. Value
About This Home
This home is located at 449 E 400 N, Santaquin, UT 84655 and is currently estimated at $513,494, approximately $183 per square foot. 449 E 400 N is a home located in Utah County with nearby schools including Apple Valley Elementary, Payson Junior High School, and Mt. Nebo Middle.
Ownership History
Date
Name
Owned For
Owner Type
Purchase Details
Closed on
Sep 8, 2006
Sold by
Nielson Joseph A and Nielson Jaime C
Bought by
Nielson Joseph A and Nielson Jaime C
Current Estimated Value
Home Financials for this Owner
Home Financials are based on the most recent Mortgage that was taken out on this home.
Original Mortgage
$35,000
Interest Rate
6.56%
Mortgage Type
New Conventional
Purchase Details
Closed on
Feb 10, 2006
Sold by
Nielson Joseph A
Bought by
Nielson Joseph A and Nielson Jamie C
Purchase Details
Closed on
Oct 26, 2005
Sold by
Nielson Celesta
Bought by
Nielson Joseph A
Purchase Details
Closed on
May 2, 2005
Sold by
Nielson Jeffery A and Nielson Celesta A
Bought by
Nielson Joseph A
Create a Home Valuation Report for This Property
The Home Valuation Report is an in-depth analysis detailing your home's value as well as a comparison with similar homes in the area
Home Values in the Area
Average Home Value in this Area
Purchase History
| Date | Buyer | Sale Price | Title Company |
|---|---|---|---|
| Nielson Joseph A | -- | Title West Title Company | |
| Nielson Joseph A | -- | First American Title Co | |
| Nielson Joseph A | -- | First American Title Co | |
| Nielson Joseph A | -- | -- | |
| Nielson Joseph A | -- | -- | |
| Nielson Joseph A | -- | -- |
Source: Public Records
Mortgage History
| Date | Status | Borrower | Loan Amount |
|---|---|---|---|
| Closed | Nielson Joseph A | $35,000 |
Source: Public Records
Tax History
| Year | Tax Paid | Tax Assessment Tax Assessment Total Assessment is a certain percentage of the fair market value that is determined by local assessors to be the total taxable value of land and additions on the property. | Land | Improvement |
|---|---|---|---|---|
| 2025 | $2,461 | $266,310 | -- | -- |
| 2024 | $2,461 | $245,025 | $0 | $0 |
| 2023 | $2,600 | $259,765 | $0 | $0 |
| 2022 | $2,394 | $246,675 | $0 | $0 |
| 2021 | $2,087 | $333,400 | $71,500 | $261,900 |
| 2020 | $2,005 | $310,400 | $62,200 | $248,200 |
| 2019 | $1,904 | $301,300 | $58,800 | $242,500 |
| 2018 | $1,815 | $273,900 | $55,300 | $218,600 |
| 2017 | $1,717 | $138,490 | $0 | $0 |
| 2016 | $1,625 | $128,425 | $0 | $0 |
| 2015 | $1,387 | $107,470 | $0 | $0 |
| 2014 | $1,240 | $95,920 | $0 | $0 |
Source: Public Records
Map
Nearby Homes
- 136 N 200 E
- 42 E 400 N
- 600 N Center St
- 341 E 100 S
- 873 N 200 E Unit 36
- 152 E 840 N Unit 16
- 842 N 160 E
- 842 N 160 E Unit 17
- 202 N Oh Henry St
- 78 N Peach St
- 902 N 160 E
- 902 N 160 E Unit 19
- 97 N Oh Henry St
- 49 S 100 E
- 923 N 200 E Unit 33
- 41 W 770 N
- 933 N 200 E
- 933 N 200 E Unit 32
- 169 W 690 N
- 225 W 500 North St
Your Personal Tour Guide
Ask me questions while you tour the home.